M Sc research
Visualization of spatio-temporal patterns in public transport data
Abstract
Public transportation systems (PTS) offer a choice of movement to people. The operation of the PTS depends on the demand created by people. In turn, the PTS also affects the activity system of those people. The operators and policy makers conduct surveys to measure the demand, in terms of patronage (number of people travelling in the bus or train), to create new plans or policies for the PTS. The demand for a transportation system depends on the activity system of the network, fare structure, network operation layout, type of PTS (different types of buses or trains), location of access points (bus stops, train stations) and their accessibility, type of service offered (point-to-point, zigzag, round trip) and the willingness of people to use PTS. As a result people travelling through the PTS network at different time form different patterns. For effective planning and management of the PTS, these patterns which distribute in space and time have to be understood.
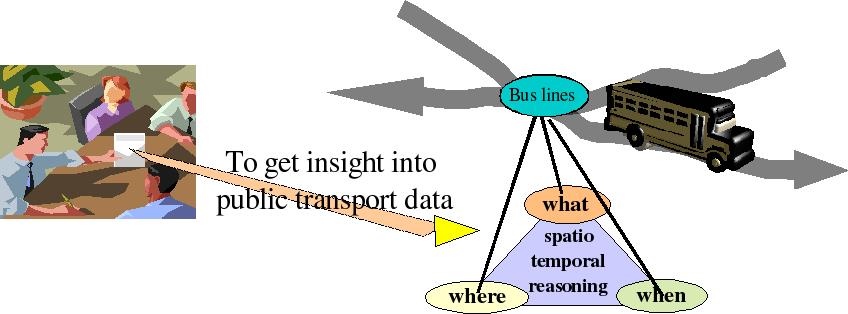
In this research work, geovisualization techniques are used to explore the spatio-temporal patterns formed by people travelling through the PTS. The spatio-temporal reasoning required by PTS operators/policy makers to extract relevant patterns from the public transport system data (comprising of its spatial network, timetable and patronage) is studied. The resulting questions are related to basic visual tasks like locate, identify, associate and compare in order to facilitate the reasoning. These are incorporated in a set of visual tools that are part of a visual environment based on time geography s space-time-cube and include multiple dynamically linked views that offer an alternative perspective on the data and patterns extracted. Finally, a visual environment that incorporates the visual tools is presented. A preliminary usability test for the visual environment is conducted with the PTS experts and its results are discussed.

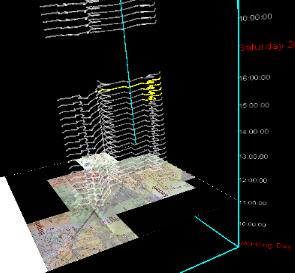
space time cube
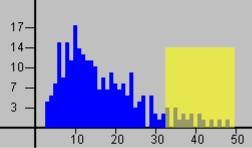
histogram
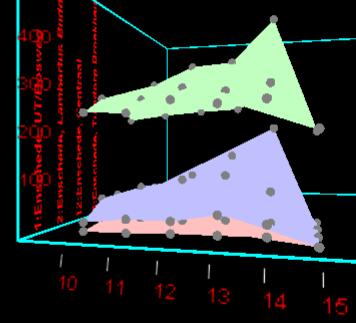
three axis plot

pcp
circleview