
1. Dow Jones Industrials
2. S&P 500
3. Dow Jones Transports
4. S&P Small Cap 600
5. Dow Jones Utilities
6. Russell 1000
7. NASDAQ 100
8. Russell 2000
9. S&P 100
10. Russell 3000
11. S&P Mid Cap 400ĀĀ
When interpreting the chart above, you need to remember that the most important factor is the relationship between Index Price and the Volume Moving Average (VMA). Here we see that the index has taken an advancing trend with not much supporting volume to cause this change. This occurs because investors are taking profit from covering their short orders; this causes the market to increase. When the VMA has peaked, professional investors once again enter into a short position by selling; this action causes the index to trend down again. It is just after this VMA peak that one should make a trading decision.
Below is an example of how one of their exclusive institutional investors used this signal for the index to maximize profits by trading some of the derivatives of the Dow Jones Industrials index:
|
Security |
Return |
||||
|
|||||
Listed below are some of the derivatives which you can trade using this indicator:
|
By trading index securities using their volume indicators instead of stocks, you gain stability and predictability that stocks do not have. An index is a far more logical in its actions than the individual stocks it is based upon.
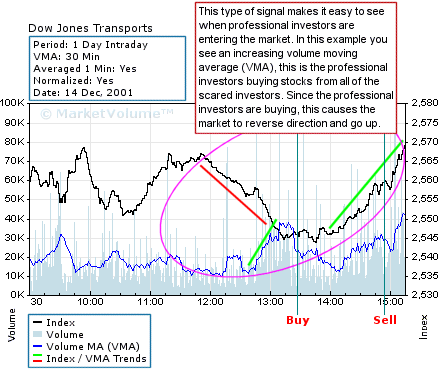
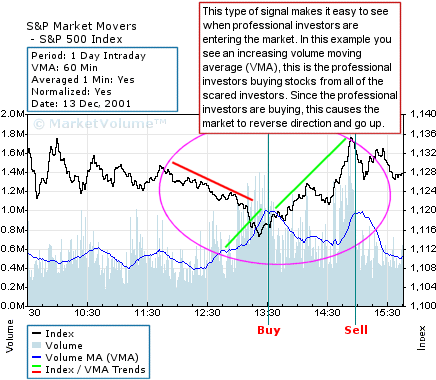
When interpreting the chart above, you need to remember that the most important factor is the relationship between Index Price and the Volume Moving Average (VMA). In this example, the index is in a downward trend just after 12:00. The downward trend continues until the VMA has reached a peak and this sharp increase in the VMA signals that a bottom has been reached for the day and that professional investors are buying. Once the VMA has peaked, that signals the safest point in which to make a trading decision, as it is here that the index has confirmed a new upwards trend.
When interpreting the chart above, you need to remember that the most important factor is the relationship between Index Price and the Volume Moving Average.
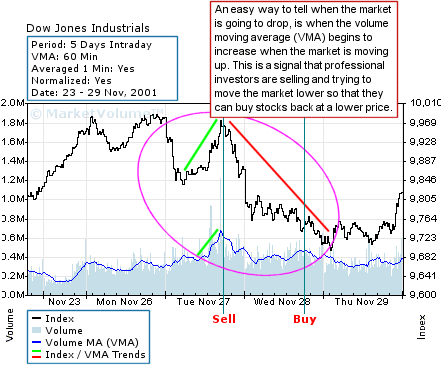
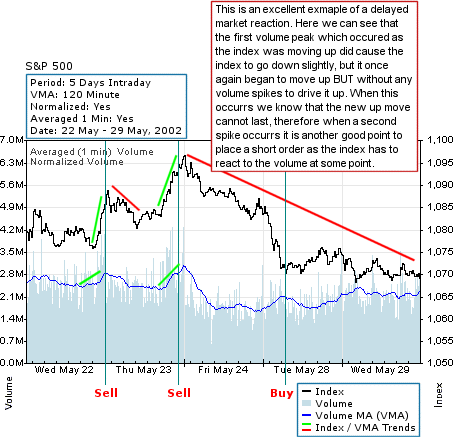
ĀIn this example we have several signals of when to make a trading decision, but for this purpose we will only explain the two in the circles. The first signal shows us that just before the index drops substantially, there was very large increase in the VMA, since the index was only on a small downwards trend before this VMA spike, we assume that the index was still trending up. Because the index is in an upwards trend when the VMA spike occurred, that is a signal that professional investors are selling and that the index will soon drop substantially. It is just after this peak in the VMA that we would make a trading decision.
In the second signal we see that once again the index is in an upwards trend, and that the increase in the VMA can only mean that investors are once again selling and that the index will begin a new trend downwards. Since the second signal is not as substantial, we know that the index will not decrease as much or as quickly as in the first signal.

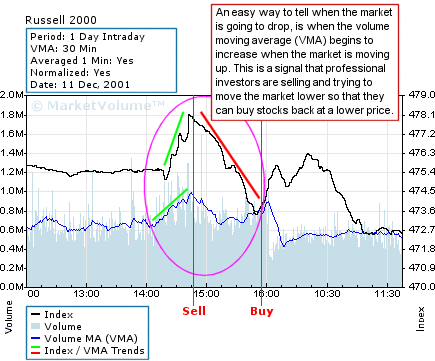
When interpreting the chart above, you need to remember that the most important factor is the relationship between Index Price and the Volume Moving Average Since the index was trending down when the VMA spike occurred it is a signal that professional investors are covering shorts and buying, that means that the index will soon change direction and go up. It is during or just after this peak in the VMA that we would make a trading decision. As the index begins to fall we see that the volume moving average is beginning to increase quickly. It is at the peak of his new VMA spike that we should look at making another trading decision as this VMA spike signals an end to the downward trend.
With the NASDAQ 100 Indicator you can accurately foretell changes in the direction of the NASDAQ 100 Index or the NASDAQ Composite Index, as the NASDAQ Composite and the NASDAQ 100 Indexes retain the same essential momentum patterns. By knowing the future directional changes of the NASDAQ in advance, one could trade securities which tracks the performance of the NASDAQ 100.

When interpreting the chart above, you need to remember that the most important factor is the relationship between Index Price and the Volume Moving Average Here we see that the index has been trading down for almost 2 days, and at the end of those two days the VMA begins to increase substantially. This sharp increase signals that a bottom has been reached and that professional investors are buying. Once the VMA has peaked, that signals the safest point in which to make a trading decision, as it is here that the index has confirmed a new upwards trend.
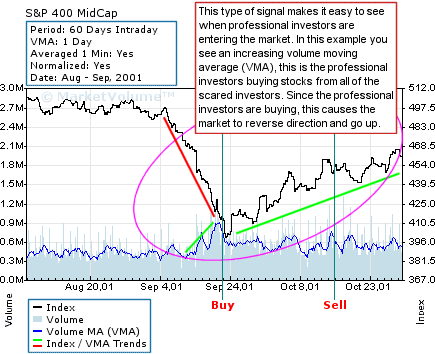
When interpreting the chart above, you need to remember that the most important factor is the relationship between Index Price and the Volume Moving Average. Here we see that the index has been trading down for almost 2 weeks, and at the end of those two weeks the VMA begins to increase substantially. This sharp increase signals that a bottom has been reached and that professional investors are buying. Once the VMA has peaked, that signals the safest point in which to make a trading decision, as it is here that the index has confirmed a new upwards trend
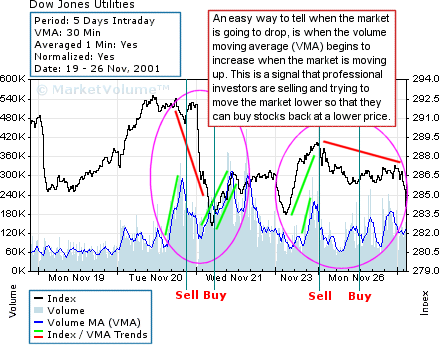
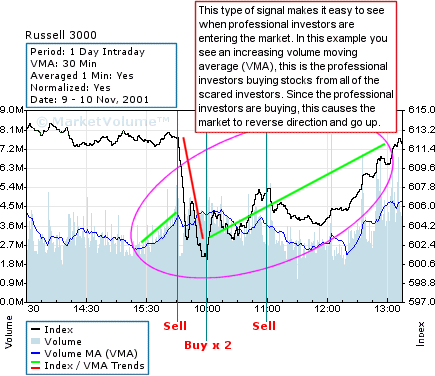
When interpreting the chart above, you need to remember that the most important factor is the relationship between Index Price and the Volume Moving Average These two signals are excellent indicators to when to short the market. In the first example we see that the index has been trending up for a short period, and that the VMA during that period has been begun increasing. This increasing VMA signals that there is a some selling pressure and that the market will change direction. The peak of the VMA signals that the market will take this new direction. But what happened was that the index only declined a short bit before resuming an upward trend on no volume. When this occurs we expect that the index will decline again soon as it did not have supportive volume on it's move upwards.
On the second signal we can see that the market did change direction substantially and that the main reason for an increasing VMA here is profit taking. This profit taking will cause the index to change direction again until there is renewed buying pressure in the future.

When interpreting the chart above, you need to remember that the most important factor is the relationship between Index Price and the Volume Moving Average. In this example, the index has been in a downward trend for 2 days. The downward trend continues until the VMA has reached a peak and this sharp increase in the VMA signals that a bottom has been reached for the day and that professional investors are buying. Once the VMA has peaked, that signals the safest point in which to make a trading decision, as it is here that the index has confirmed a new upwards trend.

When interpreting the chart above, you need to remember that the most important factor is the relationship between Index Price and the Volume Moving Average In this example we see that the index is trading sideways for the first part of the day, and then VMA begins to increase quite rapidly. In this case, the index and the VMA are both increasing, this is because the professional traders are selling AND covering their shorts. Generally when an index and the VMA both increase, that signals that the index will begin to decrease after the VMA has peaked. In this example you can see that not long after the VMA peaked the index began to decline. It is just after the VMA begins to fall that you should make your trading decision.
When interpreting the chart above, you need to remember that the most important factor is the relationship between Index Price and the Volume Moving Average In this example we see that the index is trading sideways for the first part of the day, and then VMA begins to increase quite rapidly. In this case, the index and the VMA are both increasing, this is because the professional traders are selling AND covering their shorts. Generally when an index and the VMA both increase, that signals that the index will begin to decrease after the VMA has peaked. In this example you can see that not long after the VMA peaked the index began to decline. It is just after the VMA begins to fall that you should make your trading decision.
When interpreting the chart above, you need to remember that the most important factor is the relationship between Index Price and the Volume Moving Average). This signal shows us that just before the index drops substantially, there was very large increase in the VMA. Since the index was in a slight upwards trend when the VMA spike occurred, that is a signal that professional investors are selling and that the index will soon drop substantially. It is at or before this peak in the VMA that we would make a trading decision. After the market has dropped substantially, we look for another peak in the VMA which signals a bottom in the market. In this example the VMA peak (and width) were very substantial, and therefore it signals that the market will reverse direction quite dramatically.
When interpreting the chart above, you need to remember that the most important factor is the relationship between Index Price and the Volume Moving Average In this example, the index is in a downward trend just after 12:00. The downward trend continues until the VMA has reached a peak and this sharp increase in the VMA signals that a bottom has been reached for the day and that professional investors are buying. Once the VMA has peaked, that signals the safest point in which to make a trading decision, as it is here that the index has confirmed a new upwards trend.
Listed below are some of the derivatives which you can trade using this indicator:
|
 |  |  |