|
|
|
Determination of Audience Size for Marion CATV Local-Origination Programming Written July 30, 1970
There is a possibility that when I graduate from the Syracuse University master's program, I will be employed by Marion CATV Incorporated. This CATV system serves Marion, Ohio, population about 50,000. Marion CATV delivers to its 6,000 subscribing homes not only the signals of the four Columbus, Ohio, television stations but seven others as well, the latter being "distant" stations located in cities like Cleveland and Dayton. The twelfth [and final] channel on the cable, Channel 3, is devoted to local programming. For the first couple of years of Marion CATV's operation, Channel 3 was mostly an automated weather-board service. However, following the FCC ruling last fall requiring CATV systems with more than 3,500 subscribers to begin local programming for real by 1971, the Marion system has built a small downtown studio. TV-3 began on a regular basis on June 1 of this year. It consists, at last report, of about 22 hours a week of live and video tape programs, including commercials, all produced in the Marion studios. Those hours fall between 10:00 a.m. and 12:00 noon and between 5:30 and 8:00 p.m., five days a week. Not all those 22 hours a week are unduplicated; for example, the "Jolly Jingles" children's show is presented live at 5:30 each afternoon, and a video tape of the same program is seen at 10:00 the next morning. Most programs are seen on each of the five days. Programs are generally half an hour or less in length; there's one that's only ten minutes. The goal of Marion CATV is to make TV-3 a self-supporting venture, rather than letting it operate at a loss and offset that loss with income from subscribers' fees. TV-3 is intended to bring in more money from advertising than it spends on programming, so it operates on a very low budget. Even with that, the figures are currently still in the red, for not all the available advertising time is being sold. This is hardly surprising; the local-origination service has just begun, and advertisers may well doubt that significant numbers of people are watching. Benefits of Gathering Data To prove that there is an actual audience, not just a potential audience of 6,000 homes, Marion CATV may find it advantageous to conduct a survey. This paper describes how this could be done, keeping in mind the condition that the cost should be as low as possible. There's a second reason for the survey: to show the TV-3 programmers what sort of public acceptance their current offerings are getting so that they can have some idea of what future offerings should be like. And there's a third reason, a side effect of the method described in this paper. If there are people who are not yet cable subscribers because they figure that they wouldn't watch those other eight (not-Columbus) channels enough to justify the expense, it will be possible to say to them something like this: "We took a survey and found that of the subscribers who had their sets on, 46% were watching something other than a Columbus station." A point like that might bring in a few additional subscribers. Goals This survey is intended to apply to all 22 hours during a week when TV-3 is programming. (It could be cut back to a smaller scope for budgetary considerations.) The suggested week is November 2 through 6, 1970, because that week is (1) relatively soon, (2) in a cold-weather, early-sunset month when the number of homes using television should be comparatively high, and (3) during the season when both political programs and the high school football films will be on the cable to draw larger audiences. The questions to be answered by the survey are these three: (1) During a given TV-3 program, how many homes in Marion are tuned to each of the twelve cable channels? (This should be expressed in an average homes figure. If, for example, a program is presented five days a week for half an hour each day, the average should be taken over the entire 2½-hour period.) (2) In those homes which are actually tuned to the TV-3 program, how many men, women, and children are watching at an average moment during the week? (3) Having determined the average audience at any given instant, what is the total audience (again in terms of homes, men, women, and children) that views a given TV-3 program at some time or other during the week? All the preceding questions are to be answered with numbers, not percentages. This is because TV-3's competitors are not the other eleven television channels but rather the local radio station and the local newspaper, at least when it comes to selling advertising to Marion advertisers. Therefore, traditional TV rating percentages are not as important as the number of actual viewers that an advertisement can reach. Method
The
research method to be used is an old standby, the telephone
coincidental interview. However, since this method can't
normally be used to determine total audience figures, a
modification is necessary, which will be explained presently. |
||||||||||||||||||||||||||||||||||||||||||||||||||||||||||||||||||||||||||||||||||||||||||||||
|
ASSUMPTION ONE. We must make the standard statistical assumptions that are made whenever a sampling technique is used to determine the characteristics of a larger "universe." For example, we assume that if we telephone people randomly, we will come rather close to determining the behavior of the entire universe, including those we didn't telephone, provided only that our sample is large enough. |
A corps of eight interviewers will be used. Each will be given forms like this one. The forms will already have telephone numbers on them, selected by random methods from the master list of some 6,000 CATV subscribers.
The form has spaces to identify the interviewer, the date, and the starting and ending times. Then there are 22 rows and 22 columns. The first columns are for account number and phone number. Next there are columns to be checked for "busy" or "no answer," and then the following. A: "This is Marion Audience Surveys; do you have a television set? Is it on right now?" (If not, go to E.) B: "Could you tell me what channel you're watching?" (Enter channel number; if not 3, go to E.) C: "The program that's on now, do you watch it often? About how many times a week, would you say?" (Eleven columns are provided, so that if the interviewee answers, "Oh, three or four times, I guess," the interviewer can check 3½. The zero column is for people who never watch the program but happened to have it on by accident when the phone rang; the ½ column is for very occasional viewers.) D: "Could you tell me how many men, how many women, and how many children are watching right now?" (Enter numbers.) E: "Thank you; goodbye." Under "Remarks," the interviewer can note any questions that the interviewee refused to answer. For each program, 10 phone numbers per day will be given to each interviewer; this means that each program's audience will be estimated from a week-long sample of 10 x 5 x 8 = 400 interviewees, minus any busy signals and otherwise unintelligible answers. This sample is sufficiently large so that, for example, if a result indicates an average audience of 60 homes, it is 95% certain that the true average audience is between 54 homes and 66 homes. With samples of this size, very nearly all the Marion CATV subscribers will be called at some time during the week. The random selection process should be such that any one subscriber is not called more than once, to avoid any annoyance. The exact details of this selection process depend on the list of subscribers: whether it's in the form of typewritten pages, cards, ledger pages, or whatever. Cost The cost of the survey can be broken down into four classifications: planning, preparation, interviewing, and analysis. The preliminary planning is to a large extent being done in the writing of this paper, and the remainder would be done by me (if I'm hired by Marion CATV) in my free time, so that would cost the company nothing. The preparation of the phone-number lists and entering them on the forms would be done by the secretarial staff and would cost, very roughly, about $50 (on the basis of 6,000 numbers entered at the rate of four per minute at the wages of two dollars an hour). The interviewing would be handled by the corps of eight, of whom hopefully some would be volunteers (like the wives of CATV employees); if they each worked 25 hours during the survey week and were paid an average of a dollar an hour, the cost would be $200. Finally, the data analysis would again be done by me in my spare time. Total estimated cost, then, is somewhere around $250. If the survey turned out to be successful in attracting additional advertisers, it could pay for itself in a short time. Data Analysis As I've already mentioned, this survey attempts to obtain total-audience data from a telephone coincidental survey, which is rather unusual. In fact, the method for doing this was invented by me for the purpose of this paper, though a similar method may well have been invented previously by someone else and may merely have escaped my attention. Because of this novelty, the method should be explained in detail. Let's first assume that we have a certain five-days-a-week program, The Show, and a hypothetical universe of 10,000 potential viewers. Of these, 1,000 regularly view The Show every day except Friday; another 1,000 view it only on Tuesdays and Thursdays; and the remaining 8,000 never view it at all.
The
total (weekly) audience rating, then, is 20%, for 2,000 out
of 10,000 view it at least once a week. To find the average
(weekly) audience rating, we can divide the actual number of
viewer-programs per week (1,000 x 4 plus 1,000 x 2, or 6,000) by the
potential number of viewer-programs per week (10,000 x 5, or
50,000). The result of this division is 12%, which means that
averaged over the week, 12% of the universe is viewing The Show at
any given time that it's on. |
|||||||||||||||||||||||||||||||||||||||||||||||||||||||||||||||||||||||||||||||||||||||||||||||
|
ASSUMPTION TWO. Here we are implicitly assuming that a person who "watches The Show on Monday" watches the entire program from beginning to end, and that therefore the total number of people who see that program on Monday is equal to the average number of people who are watching it at any given moment on Monday. Actually, the average will be somewhat less than the total, because some people will not be watching for the entire time period and should therefore be only partially included in the average audience figure. But this discrepancy will be small because the programs are short. He who watches part of The Show will probably watch it all. |
What is the relationship of the total and average ratings? We find that it is the multiplicative factor 3/5, since 12% is 3/5 of 20%. This factor arises from the fact that the average member of the total audience views The Show on three out of the five days it is presented in a week. How is this? There are 2,000 people in the total audience; half of them view The Show four days a week, half of them two days a week, so the average is three days; which is to say that the average viewer, out of those 2,000 who do view, views The Show three days out of five; so on an average day, 3/5 of those 2,000 viewers are actually watching, or 1,200 viewers, which is 12% of the universe. We can express the relationship in the formula AFOW x TA = AA, which means that the Average Fraction Of the Week viewed by those who do view, times the number of those who do view (the Total Audience), equals the average number viewing at any time (the Average Audience). In this hypothetical example, we've been assuming that we are omniscient and can know exactly what every person in the universe is doing. But in reality we can know only the behavior of a sample. Let's see what we have to do to obtain these AFOW, TA, and AA figures if we conduct a survey of our hypothetical universe of 10,000, sampling only 150 and inferring the figures from the results we get. Over the course of a week, we call 30 potential viewers every day while The Show is on, using the survey method proposed in this paper. If our hypothetical audience behaves the way we've assumed, we should get the following results:
These figures can be obtained from the responses to questions "B" and "C" on the interviewers' forms. From them, the average audience is easy to calculate. We made 150 calls, and 18 people happened to be viewing The Show when we called, so the average audience is 18/150 or 12%. To find the total audience, it is best first to find the Average Fraction Of Week figure. At first glance we might think the AFOW was 2/3. This is because 12 people said they watch 4/5 of the week while 6 people said they watch 2/5 and the average of these responses is (4/5 of 12 plus 2/5 of 6) divided by (12 plus 6) = (9.6 + 2.4) / 18 = 12/18 = 2/3.
But
this isn't correct; being omniscient, we know that in our actual
universe there are equal number of 4/5 people and 2/5 people, not
twice as many of one kind as of the other. A distortion arises
because the person who watches 4 days a week is twice as likely
to get to "cast his vote" as the person who watches only 2
days a week, since a person is queried about his frequency of viewing
only if he happens to be viewing when the interviewer calls. |
|||||||||||||||||||||||||||||||||||||||||||||||||||||||||||||||||||||||||||||||||||||||||||||||
|
ASSUMPTION THREE. We must assume, of course, that the AFOW figure reflects the true habits of the audience in the sense that the answers to question "C" are accurate. Here we're on rather shaky ground, since question "C" requires the interviewee not to report specific behavior but to estimate his customary behavior. Honest mistakes are easily possible. For example, a person who watches the TV-3 local news three nights a week might believe that he watches it two nights a week, or four. Also, there's the possibility of a "prestige bias": he might claim, not so honestly, that he watches the news every night. |
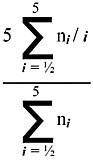
Therefore we need to use a weighted average, an average which will give the response of the viewer who says he watches 4 times a week only half as much weight as the response of the viewer who says he watches 2 times a week. Such a weighted average is (1/2 of 4/5 of 12 plus 2/5 of 6) divided by (1/2 of 12 plus 6) = (4.8 + 2.4) / 12 = 7.2/12 = 3/5. Knowing then that the AFOW is 3/5, we can easily find that the total audience is the average audience divided by the AFOW, or 12% times 5/3, or 20%. We can generalize the above example as follows. The reciprocal of the weighted Average Fraction Of Week is given by the following formula, in which i is the number of days viewed (as indicated on the column headings for question "C") and ni is the number of households that fall into the ith number-of-days category (that is, the number of check marks in the ith column when all the interviewers' forms are totaled):
Analyzing Some Fictional Data To illustrate how this formula actually works, and to show what other operations must be performed on the data in order to obtain answers to the questions we posed on pages 4 and 5, let's take some more realistic-looking data that might be obtained from the week-long survey for the local news program (6:00 to 6:15, Monday through Friday). These would be the sums of the data from forty interviewers' forms.
The first step in analyzing this data is to calculate three "multipliers."
One
is the total-audience multiplier. Using the formula given
above, this turns out to be five times (1/½ + 3/1 + 4/1½ +
3/2 + 3/2½ + 2/3 + 4/3½ + 3/4 + 2/4½ + 1/5) divided by
(1 + 3 + 4 + 3 + 3 + 2 + 4 + 3 + 2 + 1), or five times 13.57 divided
by 26, or 2.610. |
|||||||||||||||||||||||||||||||||||||||||||||||||||||||||||||||||||||||||||||||||||||||||||||||
|
ASSUMPTION FOUR. If no one answers the phone, we assume no one is at home, which in turn implies that the TV set is off. Therefore a "no answer" is included as part of the sample. |
Another is the homes multiplier, which is defined as the number of homes in the Marion CATV systems which are represented — with respect to question "B" — by each home comprising our sample. This is calculated by dividing 6,000 (the total number of homes in the Marion CATV system) by the sample size (which in this case is 24 + 74 + 292 - 1; that is, the sum of those who didn't answer the phone, plus those who did answer the phone and answered question "A" one way or the other, minus those who answered question "A" but refused to answer question "B" on tuning). In this case the homes multiplier is 6,000 divided by 389, or 15.42. This means that each home that our survey found tuned to Channel X represents 15.42 homes in the whole city tuned to that channel. Finally, there is the demographic multiplier, which takes into account that some people who answered question B refused to answer question D, and that therefore the sample size with respect to tuning is larger than the sample size with respect to how many people are watching. The demographic multiplier is defined as the number of homes in the system which are represented — with respect to the men-women-children data — by each home comprising our sample. The ratio of this multiplier to the homes multiplier is 29/(29-6), since 29 homes reported they were viewing Channel 3 but 6 of them, upon being asked about men, women, and children, declined to answer. So each 23 homes for tuning purposes correspond to 29 homes for demographic purposes, and the demographic multiplier turns out to be 15.42 x 29 / 23, or 19.44. Once we have these three multipliers, the data processing is a simple matter of multiplication and addition.
The data probably shouldn't be expressed so precisely, since listing the average homes audience as "447" implies that it's exactly 447 and not 446 or 448. The statistical error in the average homes figures (that is, the uncertainty which is due to the fact that we're using a sample of only 389 homes rather than 6,000) may be calculated from the formula
and turns out to be about 75. (Here N is the size of the universe, 6,000; n is the size of the sample, 389; and t is the number of homes in the sample that were tuned to the channel in question, 29.) According to the methods of statistics, this means that the true average homes figure is, with 95% certainty, somewhere between the two numbers 447 ± (2 x 75), that is, between 297 and 597. It also means that it's 68% certain that the true average homes figure lies between 372 and 522. These are fairly broad limits. Perhaps, then, it would be most indicative of the accuracy of the results (or their lack of it!) if we were to give them only to the nearest hundred, thus:
We note also that the demographic figures (men, women, adults, children, people) are even less certain than the homes figure, due to the fact that they're based on a somewhat smaller sample. And we have already noted in Assumptions Two and Three that for several reasons the total audience figures are less reliable than the average audience figures. Therefore the total-audience demographic figures, which are probably the most useful for convincing advertisers of the magnitude of the TV-3 audience, are unfortunately the least precise figures statistically. The users of this survey should be cautioned not to take the results too literally. That figure showing three thousand people in the total audience really means that the total audience is between 2,000 and 4,000. So Why Bother? The question might be raised, why take a survey at all if the results are going to be this nebulous? The answer is that there are only two other alternatives for determining the audience size: guesswork, or a much more thorough and complicated survey. On the one hand, even an inexact measurement is better than an "educated guess." On the other, a more complicated survey would also be much more expensive, and it's likely that it wouldn't be justified by the gain in accuracy. The proposed survey provides as much accuracy as is needed to answer the questions we posed, and it does it at low cost. We said that a second purpose of this survey is to "show the TV-3 programmers what sort of public acceptance their current offerings are getting." We've indicated a hypothetical set of data for the TV-3 local news, 6:00 to 6:15 p.m. Monday through Friday. If the TV-3 programmers saw this data, what might it show them? Well, the audience seems to be of a fairly substantial size, which is encouraging; but more than half of it is children, perhaps left over from the preceding "Jolly Jingles" program. Only 300 adult men in the whole city see the program at some time during the week. If the survey came up with figures like these, the TV-3 programmers should look at the newscast; is it for some reason interesting only to women and children? If so, an effort should be made to include more that would interest the man of the house. If not, the problem might be one of publicity, and in that case a drive should be launched to encourage men to watch. We also said that a third purpose of the survey was to determine in a general way what was being watched on the other eleven channels. From the table of data, we can determine that 29 homes in the sample were viewing TV-3 from 6:00 to 6:15 p.m., 159 homes were viewing the Columbus commercial stations (Channels 4, 6, and 10), 14 were viewing the Columbus ETV [now called public television] on Channel 12, and 122 were viewing a distant station. So 151 out of 324 TV sets, or 46.6%, were tuned to something other than a Columbus station. But no one was watching Channel 11 during this quarter-hour. Maybe another station should be on cable channel 11, if no one wants to watch the current offering. Conclusion So those are some of the kinds of results that could come about if the proposed survey were made. There has been no previous work in this field (i.e., the measurement of the CATV audience in Marion, Ohio), but there has been an enormous amount of work in related fields (i.e., the measurement of radio or broadcast TV audiences in other cities).
|
|||||||||||||||||||||||||||||||||||||||||||||||||||||||||||||||||||||||||||||||||||||||||||||||
|
|
|