Experimental Tracking of the Fringe Envelope
In order to test the technique described in section 6 for tracking the position of the fringe envelope, it was first necessary to generate some experimental photon counts. Simulated photon counts were created with the fake data routine described in Appendix A. Figure 17 shows example results with a peak fringe visibility of 0.5 and mean photon count of 1 photon per sample (5000 photons per second). The position measurement was averaged over twenty 5-second intervals.

Figure 17 - Experimental measurements of the position of the fringe envelope using fake data.
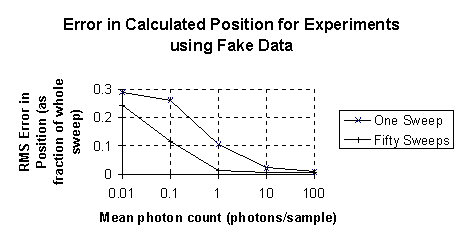
Figure 18 shows a summary of the mean errors in position measurements with a variety of different mean intensities. It can be seen that this technique is capable of providing useful measurements with mean intensities as low as 0.1 photons per sample (500 photons per second) if the position of the fringe envelope does not change significantly over any five second period.

Figure 18 - Random errors in position measurements at a variety of light intensities. The lower trace shows the random error when the measurement is averaged over fifty sweeps (five seconds of data). The position of the fringe envelope does not normally change significantly over periods of five seconds or less during astronomical measurements.
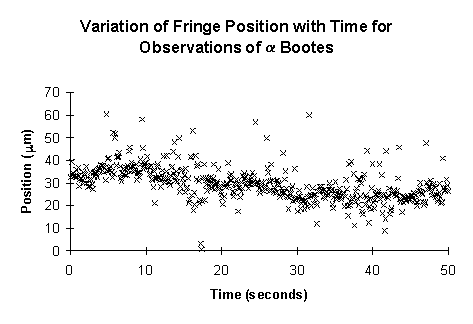
Data taken from observations of the star  Bootes in 1997 were also processed in a similar way, and the results are presented in Figure 19. The light intensity was high enough to allow reasonably accurate measurements of the position of the fringe envelope within each individual sweep. However, for several short periods during the fifty second data-set the estimated position seems to fluctuate wildly. These often coincide with times when the visibility of the fringes is very low or the shape of the fringe envelope is highly distorted. These effects may in turn be due to second order atmospheric fluctuations above individual telescopes or errors in the telescope autoguiding system.

Figure 19 - Tracking the motion of the fringe envelope for the star  Bootes. The data was taken from observations in April 1997. The mean photon count was 94 photons per sample, and the peak fringe visibility was approximately 0.4. The length of the sweep was 60
 m.
m.
Return to Bob's Interferometry Page.
Return to Bob's Home Page.