The Measurement of Complex Closure Amplitude at COAST
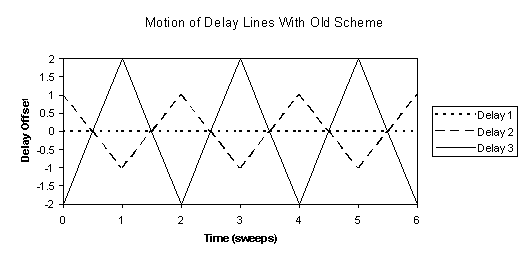
In order to calculate the complex closure amplitude of three incoming beams at COAST, the fringes are scanned past the detector, and the variation in intensity is recorded. The contributions from each of the three baselines are separated by using different scanning rates (and hence different carrier-wave frequencies) for each of the baselines. Figure 20 shows how the delay lines might be modulated in order to achieve this. Figure 21 shows the resultant motion of the fringes on the three baselines, where baseline 1 is formed from beams 1 and 2, baseline 2 from beams 2 and 3, and baseline 3 from beams 3 and 1. As the fringe velocities on each of the three baselines are generated by the velocity difference between the two relevant delay lines, they are constrained by a closure relation (the three fringe velocities must sum to zero).
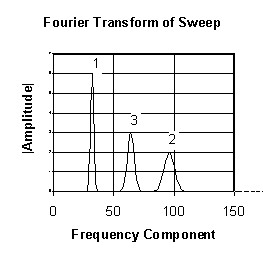
The light intensity at the detector is digitally sampled with an APD photon counter, and the data is separated into sweeps. A schematic Fourier amplitude spectrum for a typical sweep is shown in Figure 22 – the three peaks correspond to the carrier-waves for the three baselines and are labelled according to baseline. The width of the peaks is determined by the frequency modulations and amplitude modulations in the signal, which are in turn determined by the bandwidth of the optical filter and atmospheric effects. Under ideal atmospheric conditions the shape and fractional bandwidth of each peak will be the same as that of the optical filter used. The area under each peak (excluding the contribution of photon noise) is a measure of the fringe visibility on the corresponding baseline.

Figure 20 - Motion of delay lines during a complex closure amplitude measurement at COAST

Figure 21 - Motion of fringes during a complex closure amplitude measurement at COAST

Figure 22 - Fourier Transform of a typical sweep
In the first instance I will assume that the phase of the fringes does not change during the sweep.
The complex closure amplitude at a given wavelength can be estimated by selecting appropriate complex Fourier components from the spectrum and multiplying them together. The first component, at frequency  1, is selected from within the first peak in the Fourier amplitude spectrum. The second and third components are then taken at frequencies of
 ![]() and
and ![]() where
u1, u2 and u3 are the scanning velocities for baselines 1, 2 and 3. The multiple of these three components is an estimation of the complex closure
amplitude, and if the light source is a point source, it will have a phase of zero radians. It is important to note that by selecting a single Fourier component in the Fourier transform of a sweep we are effectively filtering the frequency modulated
carrier-wave with a sinc function. This filter causes the phase measurement to be dominated by light of wavenumber
where
u1, u2 and u3 are the scanning velocities for baselines 1, 2 and 3. The multiple of these three components is an estimation of the complex closure
amplitude, and if the light source is a point source, it will have a phase of zero radians. It is important to note that by selecting a single Fourier component in the Fourier transform of a sweep we are effectively filtering the frequency modulated
carrier-wave with a sinc function. This filter causes the phase measurement to be dominated by light of wavenumber
![]() , where
, where  is the frequency of the Fourier component and u is the scanning velocity.
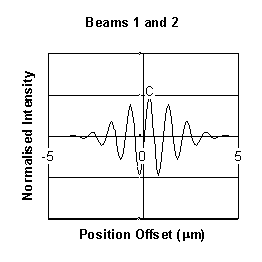
If the path length to beam 2 is altered slightly, the point of maximum constructive interference (point C) will be offset by a small amount x on the first two baselines (Figures 23 and 24). The third baseline will be unaffected (Figure 25).


Figure 23 - Baseline 1 Figure 24 - Baseline 2

Figure 25 - Baseline 3
The Fourier amplitude spectrum will be unaffected by this change (Figure 22). However, the phases of the Fourier components corresponding to baselines 1 and 2 will be altered. The phases of the Fourier components from baseline 1
will be increased by ![]() , where
, where  is the frequency of the Fourier component, u is the fringe velocity on the baseline, and x is the displacement of point C from the centre of the sweep. The phases of the Fourier components
from baseline 2 will be decreased by an equal and opposite amount. The phase of the closure amplitude (the closure phase) at each wavelength within the carrier-wave bandwidth will thus be zero, despite the phase error on beam 2. In fact the closure phase
is unaffected by phase errors in any of the incoming beams.
If the phase of the incoming beams is changing with time the velocity of the fringes relative to the detector will change. This will lead to equal and opposite Doppler shifts in the frequency of the two carrier wave signals associated with the input beam. A schematic example of this is shown in Figure 26.

Figure 26 - Frequency shift due to variation in the phase of beam 2
If a closure phase measurement is attempted with the Fourier components chosen in the same way as before, the measured complex fringe amplitude for baseline 1 will now be determined by the interference of light of slightly longer wavelength, and the measured complex amplitude for baseline 2 will correspond to light of slightly shorter wavelength. The change in spectral response is brought about because the detector scans through the fringes at a finite rate. Any atmospheric movement of the fringes leads to a Doppler shift in the fringe frequency (in other words, the measured carrier-wave is frequency modulated by atmospheric phase fluctuations). Closure relations do not apply when the spectral composition of the light used for phase measurements differs between the baselines. Fringe phases measured at different wavelengths of light on one baseline are related through the difference in the amount of dispersion applied to the two beams used. If the two beams used on one baseline are equally dispersed, the point of maximum constructive interference (point C, Figure 16) will be the same at each optical wavelength. Phase fluctuations applied to any of the input beams will then produce equal and opposite phase errors on the associated baselines. Thus closure phase measurements will be unaffected by phase fluctuations if all the input beams are equally dispersed.
If both the optical dispersion and atmospheric phase modulations are applied only to beam 2 and not to beams 1 and 3, the complex closure amplitude is influenced in two ways:
 where e is the dispersion in beam 2 (measured as change in path length per unit change in wavenumber, in units of
If beam 2 has an r.m.s. fluctuation in atmospheric phase velocity of magnitude
![]() , the following systematic error will be introduced into the closure phase measurement:
, the following systematic error will be introduced into the closure phase measurement:

It should be noted that the change in the spectral response of the phase measurement system which produces this effect is entirely due to the data-processing technique used (the numerical filtering of the carrier-waves). If all wavelengths of light in the incoming beams are treated equally by the data-processing technique, dispersive effects should not lead to systematic errors in the measured closure phase.
A systematic error is brought about only if all of the following criteria are met:
In Section 9 of this report I discuss three techniques for closure phase measurements which are not systematically affected by dispersion, the first two address criterion (4.) above, and the third concentrates on criterion (2.).
Return to Bob's Interferometry Page.
Return to Bob's Home Page.