| Electricity consumption by state in 2006-07 (TWh) |
|---|
|
| Total Australian electricity consumption (TWh) |
|---|
|
IntroductionOn 17th October 2008 the Rudd government made available to the public the Renewable Energy Atlas of Australia. Among other things, this contained a wind resource map of Australia and made it possible to identify the places in Australia where the wind resource is at its best, and do some simple calculations of the amount of wind power that could be generated if these places were developed.Of the renewable energy resources, only hydro and wind could be called mature technologies. There is little, if any, scope for additional large hydro-power development in Australia. There is scope for micro-hydro, run-of-river hydro, and for development of hydro as a short-term energy storage and recovery asset. If more than a small fraction of Australia's wind power potential is to be developed the electrical transmission system will have to be greatly expanded. This problem is dealt with on another page. Wind and solar power are intermitant; it is quite possible to link the power consumption rate with the availability of power; this is dealt with on another page. |
| ||||
|
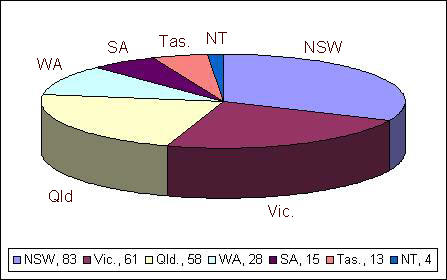
The greatest consumption is generally roughly proportional to the population of each state, although Queensland and Tasmania seem to consume more than one would expect.
Tasmania has a higher proportion of renewable energy (mainly hydro) than any other state.
|
Home Wind home Home Top Index |
|
The map shows that the best wind resources are:
Wind farms have been proposed in the Hamilton and Colac areas of Victoria, the Broken Hill, Bathurst and New England areas of NSW. I have neglected these for the purpose of estimating Australia's wind resource, because the map indicates a second rate resource in these places and this page deals only with the areas having first rate wind resources.
Scientific American (March 2009) published figures for the estimated total wind power generation for the world, (see Sustainable Energy), these figures confirm that the estimates on this page are highly conservative.
| ||||||||||||||||||||||||||||||||||||||||||||||||||||||||||||||||||||||||||||||||||||||||||||||||||||||||||||||||||||||||||||||||||||||||||||||||||||||||||||||||||||||||||||||||||||||||||||||||||||||||||||||
|
Home Wind home Home Top Index |
I have allowed for there being no wind power development in areas of relatively high population, high tourism value or in conservation or other parks.
Most of the areas shown on the wind potential map tend to be long and narrow. Consequently I have based the estimates on the length of each area and the number of rows of turbines that could be installed in that area. Again, these figures are in most cases very conservative; for example, the 'Shark Bay to Moora hinterland' area of high wind is some 40 to 100km wide, it most likely could support more than three rows of turbines.
Within each row I have assumed four 2MW turbines per kilometre, based on several existing wind farms in Mid North South Australia.
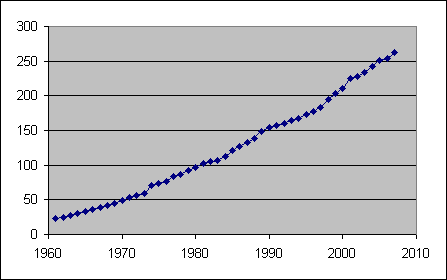
The total, 91 760MW installed capacity, using a capacity factor of 30%, gives an annual electricity generation of 241 TWh, not far short of the total Australian electricity consumption for the 2006-07 year, 262TWh.
Highlands have better wind resources than lowlands: for example, the Victorian and NSW Alps and the Atherton Tablelands of north Queensland. The strip of high quality resource running north from Ravensthorpe in WA corresponds to a plateau.
Any line of hills that lies across the direction of the prevailing winds seems to have a particularly good resource: the north-south trending Mount Lofty/Flinders Ranges, for example, lie across the prevailing westerly winds of the area.
I have listed Kangaroo Island as having potential for 4 rows of turbines each 60km long (960 turbines and 1920MW of installed power); this is very conservative, but follows the rule of thumb I have used elsewhere. I visited Kangaroo Island in January 2009 and am convinced that it could support several times as much wind power as this without compromising its excellent tourism and environmental values. An estimate of 4GW would still be conservative.
KI has a population of around 4500; assuming two people per houshold and 1kW power consumption per house we can calculate a domestic load for KI of 2.25MW. Assuming another 2.25MW for industry, the total load would probably be near 4.5MW; about one thousandth of the potential wind generation capacity for the island. Calculating $7000 land leasing fee for each 2MW turbine and 2000 turbines, the potential earning from this source alone for the island would be increased by $14 million annually; about $3100 per person. There would also be employment for the people needed to maintain the wind farms.
To deliver the power to a market (in Adelaide) would require a
transmission
line about 200km long.
Wind power potential and consumption, by state | ||||||||
|---|---|---|---|---|---|---|---|---|
|
| |||||||
|
Home Wind home Home Top Index |
Matching electricity consumption to generation
Spatial matchingThe states with the best wind resources do not match the states with the greatest electricity consumption, as shown in the table on the right and the pie diagrams above.WA, with by far the greatest wind resource, is a long way from the big electricity consuming states of the east, probably too far for the current state of power transmission technology. (High Voltage Direct Current [HVDC] is increasingly used to efficiently transmit large quantities of power over long distances.) Transmitting power from SA to the eastern states would be a practicality, while perhaps progressively moving high consumption industries such as aluminium smelting from the mainland eastern states to WA could be considered if the wind resource is to be utilised and Australia's greenhouse gas production rates reduced. Temporal matchingThe other main problem with using large percentages of wind (or solar) energy in any national system is the miss-match between the timing of availability and consumption. This can be alleviated to some extent by making consumption rates responsive to electricity availability (called price-responsive-load), I have discussed this in Sustainable electricity. Methods of efficiently storing electricity are discussed on the same page. | |||||||||||||||||||||||||||
Off-shore wind power
Technological and financial constraints preclude developing the resource in deep water at present, but turbines could be erected anywhere around the coast in the shallower waters. The Australian off-shore wind resource is potentially similar in size to the on-shore resource. As costs are higher there is no good reason to expect off-shore development before good on-shore sites are used up. Therefore I have not put any numbers to off-shore potential for the present. Bass StraitWikipedia states that Bass Strait is generally around 50m deep.In Bass Strait the continental shelf extends from west of King Island around 500km to east of Flinders Island and the Strait is about 200km wide. Bass Strait has the advantage of being close to the most populated part of Australia. It seems that if off-shore wind power was to be developed on a large scale anywhere in Australia, the shallower parts of Bass Strait would be attractive. Cost of off-shore wind powerThe recently opened (November 2008) Snowtown Wind Farm had a total cost of Aust$220 million for 99MW of wind turbines: Aust$2.22 million per MW. The Princess Amalia Wind Farm off the cost of the Netherlands - which exported its first power in December 2007, as did Snowtown - cost 383 million Euros and is rated at 120MW. 383 million Euros converts to Aust$729 million (Nov. 2008), giving a cost of Aust$6.07 million per MW.
| ||||||||||||||
Will it affect the weather?A wind turbine takes energy from the wind by slowing the wind. The wind tends to flow around any obstacle that restricts its movement. An entire wind farm would presumably tend to divert the wind flow on a larger scale than a single turbine. If 50 to 100GW of wind power was developed in Australia there would be a slightly increased tendency for winds to blow around the continent rather than over it. Would it be significant? I don't know.There are two effects, not only is the direction of the wind slightly changed, but energy is taken from the wind. One turbine taking 2MW of power from the wind, or even 100 turbines taking 200MW from the wind probably has very little affect on the weather, but 50 000 turbines taking 100GW from the wind? The effect on the wind would be something like planting extensive forests where before there was bare ground. Would it significantly change the weather? I don't know. Moving from fossil fuel to wind is a technological 'fix' to the primary problem that we are using energy wastefully. Technological fixes can always have unforseen and undesirable consequences. Using a mix of wind, solar, geothermal, biological and other sustainable energy would be safer than relying on just wind. Using a mix of distributed (eg. solar panels on house roofs) and centralised utility scale power production would be safer than relying on just the latter. But the safest thing of all would be to reduce our energy consumption. |
|
Home Wind home Home Top |
IndexAustralian electricity consumptionContents Electricity consumption compared to resource Introduction Kangaroo Island Matching electricity consumption to generation Off-shore development Potential on-shore wind development in Australia Potential wind power in Australia by state Top Where do the best resources tend to be? Will it affect the weather? Wind power potential in Australia Wind resource map of Australia |

