


Our Solution
ServiceTrax: Information Tracked
The information tracked by ServiceTrax™ can be divided into three distinct categories:
- Performance metrics
- End user tracking
- Usage profile
Performance Metrics
We measure everything we do so you know just how good our service really is. And numbers don't lie. Comprehensive call-tracking capabilities and management reports measure response time, availability, accuracy, and tell you how well we satisfy your end-users' needs.
You will find out how well your users' needs are being met, both by the performance of the system and the effectiveness of the solutions. This will provide you and us with many insights and opportunities to improve both the viability and the cost effectiveness of your support model and knowledge base. This will allow us, as a team, to build a higher quality service relationship with your customer or user base. Tangible measurements of performance are available for your review at any time from our password-protected website.
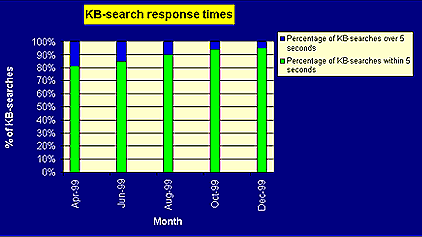
Example of response time report
End User Tracking
We track where your users are coming from and what they do when they get to the support site. This allows you to obtain a better understanding of who your customers are, what they are doing, and where they are having problems. You can slice this information in many ways. For example, you can easily find out if users in certain geographic areas are having a certain problem with much higher frequency than in other areas of the world.
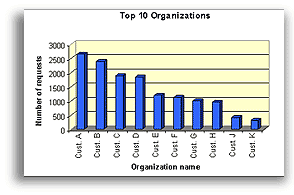
Example of simple customer report
The trustedanswer™ reporting philosophy draws a distinction between current data and trending data. We want our clients to be able to make informed customer support decisions based not only on the most current information, but also in the context of the broader business environment. To this end we have developed a suite of management reports that highlight changes over time. This type of reporting can be most useful where a product's volume has a regional or seasonable component. This standard reporting structure can also present you with a view of your customers behavior by city, state and organization.
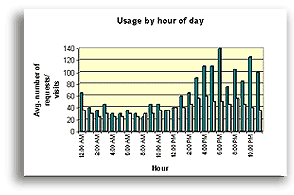
Example of hourly traffic report
Usage Profile
Your usage profile provides you the information you need to know on the actual delivery of support to your end users. This includes where the most problems are being encountered, the efficiency of finding solutions, and communication paths chosen. For example, you can find out which communication paths are most preferred by your customers and how that is changing over time.
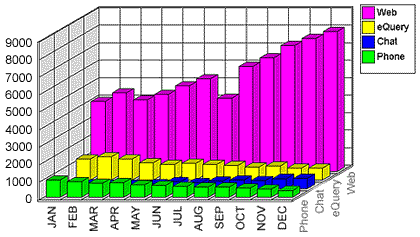
Example of communication path trend report
Detailed management reports let you enhance service in problem-prone areas, improve solution-finding algorithms, and track changes in support delivery over time. And that helps you satisfy and retain current users while improving the efficiency of support delivery.

| home | company | esupport | our solution | news | employment | contact us | privacy policy | webmaster |
Use of this site indicates you accept the Terms of Use. © 2000-2001 Amdahl Corporation. All Rights Reserved.