|
An Evolutionary Adaptive Learning Model with Fundamentalists and Moving Average Traders
6.1 Introduction
Chapters 2 through 5 of this thesis contain empirical analyses whether technical trading has statistically significant forecasting power and yields economically significant profits when applied to financial time series. The present chapter builds a simple theoretical financial market model with fundamentalists and technical analysts.
An important question in heterogeneous agents modeling is whether irrational traders can survive in the market, or whether they would lose money and are driven out of the market by rational investors, who would trade against them and drive prices back to fundamentals, as argued by e.g. Friedman (1953). In the last decade a number of theoretical and/or computational heterogeneous agent models, with fundamentalist traders competing against technical analysts, have been developed, see e.g. in Frankel and Froot (1988), De Long et al. (1989, 1990), Kirman (1991), Wang (1994), Lux (1995), Arthur et al. (1997), Brock and Hommes (1997, 1998), Farmer (1998), Hong and Stein (1999) and LeBaron et al. (1999). A common feature of these contributions is that technical traders may at times earn positive profits, survive evolutionary competition and need not be driven out of the market by trading strategies based upon economic fundamentals.
Brock and Hommes (1998) investigate the dynamical behavior of a simple financial market model with heterogeneous adaptively learning traders, where the fraction of traders following a certain forecasting rule changes over time. The traders are restricted to choose from a finite set of fundamental and trend following trading techniques. How many traders are using a particular technique in predicting prices depends on the past performances of these techniques, as measured by past profits or forecasting accuracy. Emphasis is placed on the change in dynamical behavior when the intensity of choice parameter, measuring how quickly agents switch between forecasting techniques, is varied. It is found that increasing this intensity of choice can lead to market instability and the emergence of complicated dynamics for asset prices and returns, with irregular switching between phases where prices are near to the fundamental value and phases of optimism where traders extrapolate trends. An extremely rich asset price dynamics emerges, with bifurcation routes to strange attractors, especially if switching to more successful strategies becomes more rapid. It is also found that even when costs of information gathering and trading are zero, then fundamentalists are in general not able to drive other trader types out of the market. Thus it is concluded that simple technical trading rules may survive evolutionary competition in a heterogeneous world where prices and beliefs coevolve over time and that therefore the Friedman argument should be considered with care. See e.g. Hommes (2001) for a survey and an extensive discussion of these points.
One of the goals of heterogeneous agents modeling is to develop simple financial asset pricing models that mimic the well-known characteristics of real financial return distributions, such as little autocorrelation in the returns, volatility clustering and fat tails. Gaunersdorfer and Hommes (2000) develop a model in which volatility clustering becomes an endogenous phenomenon by the interaction of heterogeneous agents. Volatility clustering is caused by the coexistence of attractors, a stable fundamental steady state and a stable (quasi) periodic cycle. The time series properties of the model are compared with the daily closing prices of the S&P 500 in the period August 1961 through May 2000 and furthermore a GARCH model is estimated. It is concluded that the model approximates reality fairly well.
This chapter is an extension of the Brock and Hommes (1998) model in that it adds a real moving-average technical trading strategy to the set of beliefs the traders can choose from. Moving averages are well known and frequently used prediction rules in financial practice. They are intended to smooth out an otherwise volatile time series and to show its underlying directional trend. Furthermore, the model proposed in this chapter assumes that traders have constant relative risk aversion. That is, every trader in a given belief group invests the same proportion of his individual wealth in the risky asset. Hence, traders take the same amount of risk relative to their wealth. In the Brock and Hommes (1998) model, in contrast, it is assumed that the traders have constant absolute risk aversion. Irrespective of their individual wealth every trader in a certain belief group will buy or sell short the same amount of stocks. Thus traders with less wealth are prepared to take greater relative risks than traders with more wealth. It should be noted that in the case of zero supply of outside stocks, the model developed in this chapter reduces to the Brock and Hommes (1998) model.
In nonlinear dynamical models it is in general impossible to obtain explicit analytic expressions for the periodic and chaotic solutions. Therefore in applied nonlinear dynamics it is common practice to use a mixture of theoretical and numerical methods to analyze the dynamics. We perform a bifurcation analysis of the steady state by using numerical tools, such as delay and phase diagrams, bifurcation diagrams and the computation of Lyapunov exponents. In particular we show analytically that the fundamental steady state may become unstable due to a Hopf bifurcation.
In section 6.2 the Brock and Hommes (1998) financial market model with adaptively learning agents is reviewed. Thereafter, in section 6.3, the heterogeneous agents model with fundamentalists versus moving average traders, resulting in an eight dimensional nonlinear dynamical system, is derived. In section 6.4 a procedure is developed to determine trading volume. Section 6.5 presents an analytical stability analysis of the fundamental steady state. The eigenvalues of the linearized system are computed and it is examined which kind of bifurcations can occur. In section 6.6 numerical simulations are used to study the dynamical behavior of the model, especially when the steady state is locally unstable. Finally section 6.7 summarizes and concludes.
6.2 The Brock-Hommes heterogeneous agents model
In this section we discuss the discounted value asset pricing model with heterogeneous beliefs of Brock and Hommes (1998)1. Consider a market with N agents who can select independently from each other a strategy h from a finite set of H different beliefs or forecasting rules to base trading decisions upon. Agents have to make a capital allocation decision between a risky asset P and a risk free asset F. There are no restrictions on the amount of money which can be borrowed or lend and there are also no restrictions on the number of shares that can be bought or sold short. Agent j can choose to buy or sell short zj,t shares of the risky asset at time t. The wealth of agent j at time t+1 is then equal to
Wj,t+1=R Wj,t + zj,t (Pt+1+Dt+1-RPt),
(1)
where R=(1+rF) is the risk free gross return, rF is the risk free net return assumed to be constant, Pt is the equilibrium price of the risky asset at time t and Dt is the dividend paid at time t. The term (Pt+1+Dt+1-R Pt) is equal to the excess profit of one long position in the risky asset.
BH make the following assumptions regarding the trading process. All agents are price takers. That is, an agent cannot influence the market's equilibrium price by his individual investment decision. The demand for the risky asset zj,t is a continuous monotonically decreasing function of the price Pt at time t. Further, the model follows a Walrasian equilibrium price scenario. Before the setting of the equilibrium price at time t, each agent j chooses a trading strategy h and makes an optimal investment decision zj,th in the time interval (t-1, t). Expectations about future prices and dividends are made on the basis of the information set of past equilibrium prices and dividends {Pt-i, Dt-i: i ł 1 } (note that Pt and Dt are not included). Through the market mechanism an equilibrium price is set so that the market clears. Dividends Dt paid at time t can immediately be reinvested at time t.
Demand
BH define the information set It={Pt-i, Dt-i: i ł 1 } Č {Pt, Dt}, where {Pt-i: i ł 1 } are past equilibrium prices, {Dt-i: i ł 1 } are past dividends, {Dt} is current dividend, but where {Pt} is not yet necessarily the equilibrium price. The conditional expected wealth of agent j at time t who invests according to strategy h is then equal to
Ejh(Wj,t+1|It)=Ej,th(Wj,t+1)=RWj,t + zj,th Eth(Pt+1+Dt+1-RPt),
(2)
where Eth(Pt+1+Dt+1-RPt) is the forecast strategy h makes about the excess profit of the risky asset at time t+1 conditioned on It. The agent also makes a forecast about the dispersion of his expected wealth conditioned on It
Vjh(Wj,t+1|It)=Vj,th(Wj,t+1)=(zj,th)2 Vth(Pt+1+Dt+1),
(3)
where Vth(Pt+1+Dt+1) is the forecast of belief h about the dispersion of expected price plus dividend. It is assumed that if the conditional expected excess profit of belief h is positive, then the agent holds a long position in the market (zj,th ł 0) and if the conditional expected excess profit is strictly negative, then the agent holds a short position in the market (zj,th<0), so that conditional expected wealth is always equal or larger than RWj,t.
Solving the conditional variance equation (6.3) for zj,th yields
|
zj,th=± |
| Vj,th(Wj,t+1) |
|
| Vth(Pt+1+Dt+1) |
|
,
(4) |
Ej,th(Wj,t+1)=RWj,t + Sth Vj,th(Wj,t+1) if Eth(Pt+1+Dt+1-RPt)ł 0;
(5)
Ej,th(Wj,t+1)=RWj,t - SthVj,th(Wj,t+1) if Eth(Pt+1+Dt+1-RPt)<0;
(6)
| Sth= |
| Eth(Pt+1+Dt+1-RPt) |
|
| Vth(Pt+1+Dt+1) |
|
=
|
| Eth(Pt+1+Dt+1-RPt)/Pt |
|
| Vth(Pt+1+Dt+1)/Pt2 |
|
=
|
|
. |
BH assume that each agent has constant absolute risk aversion (CARA) and that the utility of the asset allocation decision of agent j who invests according to belief h at time t is given by
|
Uj,th=Ej,th(Wj,t+1)- |
|
Vj,th(Wj,t+1),
(7) |
|
Maxzj,th Ej,th(Wj,t+1)- |
|
Vj,th(Wj,t+1) under the CAL (6.5) or (6.6).
(8) |
|
zj,th(Pt)= |
| Eth(Pt+1+Dt+1-RPt) |
|
| aj Vth(Pt+1+Dt+1) |
|
,
(9) |
Market equilibrium
Equilibrium of demand and supply yields
|
|
|
|
zj,t= |
|
|
ć
ç
ç
č |
|
zj,th |
ö
÷
÷
ř |
= S,
(10) |
Further, BH assume that the conditional variance Vth(Pt+1+Dt+1)=s2 is constant through time and equal for all beliefs. This assumption of homogeneous, constant beliefs on variance is made primarily for analytical tractability. Notice however that heterogeneity in conditional expectations in fact leads to heterogeneity in conditional variance as well, but this second-order effect will be ignored. Equilibrium equation (6.12) can be solved for Pt to yield the equilibrium price
|
Pt= |
|
|
|
|
{ |
nth Eth(Pt+1+Dt+1) |
} |
- |
|
a s2 s.
(13) |
Evolutionary dynamics
The fraction of agents who choose to invest according to belief or forecasting rule h are determined by a discrete choice model. Every agent chooses the belief with the highest fitness he observes. Individually observed fitness is derived from a random utility model and given by:
Fj,th=Fj,th+ej,th,
(14)
where Fj,th is the deterministic part of the fitness measure and ej,th represents personal observational noise. If ej,th ą 0, then this model means that agent j cannot observe the true fitness Fj, th of belief h perfectly, but only with some observational noise. Assuming that the noise ej,th is iid drawn across beliefs h=1,...,H and across agents j=1,...,N from a double exponential distribution, then the probability that agent j chooses belief h is equal to
Here bj is called the intensity of choice, measuring how sensitive agent j is to selecting the optimal belief. The intensity of choice bj is inversely related to the variance of the noise terms ej,th. If agent j can perfectly observe the fitness of each belief in each period, then V(ej,th) Ż 0 and bj ® Ą and the agent chooses the best belief with probability 1. If agent j cannot observe differences in fitness, then V(ej,th)® Ą and bj Ż 0 and the agent chooses each belief with equal probability 1/H.
The excess profit of an agent following strategy h in period t is equal to (Pt+Dt-R Pt-1) zt-1h. Therefore the fitness measure of strategy type h as observed by agent j is defined as
Fj, th=(Pt+Dt-R Pt-1)zt-1h-Cjh+hj Fj, t-1h.
Here 0 Ł hj Ł 1 is the personal memory parameter and Cjh is the average per period cost of obtaining forecasting strategy h for agent j. If hj=1, the memory of the agent is infinite and Fj,th is equal to the cumulative excess profits of belief h until time t. In this case Fj, th measures the total excess profit of the belief from the beginning of the process. If hj=0, the agent has no memory and Fj, th is equal to the excess profit on time t-1. If 0 < hj < 1, then Fj,th is a weighted average of past excess profits with exponentially declining weights. The higher the costs Cjh, the more costly it is for the agent to obtain and invest according to belief h, and the more unlikely it will be that the agent chooses belief h.
BH assume that bj=b, hj=h and Cjh=Ch for all agents, so that Fj,th=Fth and qj,th=qth are equal for all agents. This means that all agents have the same intensity of choice, have the same memory and face the same costs for trading. Under this assumption, in the limit, as the number of agents goes to infinity, the fraction of agents who choose to invest according to belief h converges in probability to qth. Thus in the equilibrium price equation (6.13) nth can be replaced by qth. Furthermore, it is assumed that all agents have the same risk aversion parameter aj=a, so that agents who follow the same forecasting rule have the same demand. Hence, in the end, in the heterogeneous agents model of Brock and Hommes (1998), the agents are only heterogeneous in the beliefs they can choose from.
6.3 A modified heterogeneous agents
asset pricing model
6.3.1 Utility-maximizing beliefs
As in the BH model we consider a market with N agents who can select independently from each other a strategy h from a finite set of H different beliefs or forecasting rules to base trading decisions upon. Agents have to make a capital allocation decision between a risky asset P and a risk free asset F. Agent j can choose to invest at time t a fraction yj,t of his wealth Wj,t in the risky asset P and a fraction 1-yj,t in the risk free asset F. If Pt is the price of the risky asset at time t and Dt is the dividend paid at time t, then the net return of the risky asset at time t+1 is defined as rt+1P=(Pt+1+Dt+1-Pt)/Pt and the net risk free return is denoted by rF and is assumed to be constant. The net return of the agent's j complete portfolio C at time t+1 is then equal to
rj,t+1c=(1-yj,t) rF+yj,t rt+1P=rF+yj,t (rt+1P-rF),
where rt+1P-rF is the excess return on the risky asset. In this section we derive the demand function for the risky asset if the agent has constant relative risk aversion and determines his optimal demand for the risky asset by maximizing his mean-variance utility curve on his capital allocation line. The demand function is derived under the assumption that the agent makes price predictions. In subsection 6.3.2 we present the demand function for the risky asset if the agent does not make price predictions, but only chooses to buy or sell short the asset on the basis of a technical trading strategy.
We make the following assumptions regarding the trading process. All agents are price takers. That is, an agent cannot influence the market's equilibrium price by his individual investment decision. Further, the model follows a Walrasian equilibrium price scenario. Each agent j chooses a strategy h and makes an optimal investment decision yj,th in the time interval (t-1, t), before the setting of the equilibrium price at time t. Expectations about future prices and dividends are made on the basis of the information set of past equilibrium prices and dividends {Pt-i, Dt-i: i ł 1 } (note that Pt and Dt are not included). Through the market mechanism an equilibrium price is set so that the market clears. Dividends Dt paid at time t can immediately be reinvested at time t.
We define the information set It={Pt-i, Dt-i: i ł 1 } Č {Pt, Dt}, where {Pt-i: i ł 1 } are past equilibrium prices, {Dt-i: i ł 1 } are past dividends, {Dt} is current dividend, but where {Pt} is not yet necessarily the equilibrium price. The conditional expected portfolio return of agent j at time t who invests according to strategy h is then equal to
Ejh(rj,t+1c|It)=Ej,th(rj,t+1c)=rF+yj,th Eth(rt+1P-rF),
(16)
where Eth(rt+1P-rF) is the forecast belief h makes about the excess return of the risky asset at time t+1 conditioned on It. If the conditional expected excess return of belief h is positive, then the fraction invested in the risky asset is positive (yj,th ł 0) and if the conditional expected excess return is strictly negative, then the fraction invested in the risky asset is strictly negative (yj,th<0). Hence agent j with belief h can choose to buy shares or to sell shares short. Agent j does not only forecast his portfolio return but also the dispersion of the portfolio return which is equal to
Vjh(rj,t+1c|It)=Vj,th(rj,t+1c)=(yj,th)2 Vth(rt+1P),
(17)
where Vth(rt+1P) is the forecast of belief h about the dispersion of the excess return of the risky asset. Solving (6.17) for yj,th yields
|
yj,th=± |
|
if Vth(rt+1P)>0,
(18) |
Ej,th(rj,t+1c)=rF + Sth Vj,th(rj,t+1c) if Eth(rt+1P-rF)ł 0;
(19)
Ej,th(rj,t+1c)=rF - Sth Vj,th(rj,t+1c) if Eth(rt+1P-rF)<0;
(20)
Here |Sth| is the reward to variability ratio, or stated differently, the extra expected return to be gained per extra point of expected risk to be taken. The CAL shows the relation between the expected return and the expected dispersion of the return. The CAL is always an increasing function of Vj,th(rj,t+1c). This implies that the more risk the agent expects to take, the more he expects to earn.
We assume that the agents have a constant relative risk aversion so that the utility of the capital allocation decision by agent j with belief h is given by
|
Uj,th=Ej,th(rj,t+1c)- |
|
Vj,t+1h(rj,tc),
(21) |
|
Maxyj,th Ej,th(rj,t+1c)- |
|
Vj,th(rj,t+1c) under CAL (6.19) or (6.20).
(22) |
|
=Eth(rt+1P-rF) - aj yj,th Vth(rt+1P)=0. |
|
yj,th(Pt)= |
| Eth(rt+1P-rF) |
|
| aj Vth(rt+1P) |
|
.
(23) |
|
|
Figure 6.1: Demand function of the mean-variance utility maximizing belief
|
6.3.2 Non-utility-maximizing beliefs: technical traders
In subsection 6.3.1 we have derived the demand function for the risky asset under the assumptions that agents make price predictions and maximize a constant relative risk aversion utility function on a capital allocation line. However, if investors use technical trading rules, then they often do not try to make a point forecast of the price directly, but they make an investment decision based on the direction of a trend in prices. Pring (1992) defines technical analysis as the art of detecting a price trend in an early stage and maintaining a market position until there is enough weight of evidence that the trend has reversed. Thus, if we want to model technical traders, then we must define a demand function for the risky asset in another way as we did in section 6.3.1.
We take as an example the exponential moving-average trading rule. The advantage of this rule over the usual equally weighted moving-average trading rule is that it keeps the dimension of our model low. Demand functions for other technical trading rules can be derived according to the same concept. The exponential moving average at time t is equal to
|
|
MAt=µ Pt + (1-µ) MAt-1=µ |
|
(1-µ)j Pt-j + (1-µ)t MA0,
(25) |
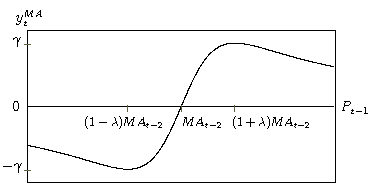
Trading signals are generated by the crossing of the price through the moving average. If the price crosses the moving average upwards, i.e. Pt>MAt Ů Pt-1Ł MAt-1, then a buy signal is generated and at time t+1 a long position in the market is taken. If the price crosses the moving average downwards, i.e. Pt<MAt Ů Pt-1ł MAt-1, then a sell signal is generated and at time t+1 a short position in the market is taken. The magnitude of the position held in the market can also be conditioned on the distance between the price and the moving average. If Pt is close to MAt, small positions should be held, because it is uncertain whether the strategy generated correct signals. It also seems reasonable to assume that if Pt is very far away from MAt, then small positions should be held, because the price exploded too fast away from MAt.
To satisfy above conditions the demand of the moving average forecasting rule, as a fraction of individual wealth at time t, ytMA, is defined as a continuous function of past prices and moving averages in the following way:
where l>0, g>0. Notice that in contrast to the fraction yth(Pt) in (6.24), the fraction ytMA of wealth invested by moving average traders in the risky asset does not depend upon the (unknown) market equilibrium price Pt, but only upon past price observations and moving averages.
The demand function (6.26) has the following properties (see figure 6.2 for illustration):
- 0cm
ytMA<0 if Pt-1<MAt-1
- ytMA=0 if Pt-1=MAt-1
- ytMA>0 if Pt-1>MAt-1
- limPt-1® Ą ytMA=0
- limPt-1Ż 0 ytMA=-2 g l/1+l2
- d ytMA/d Pt-1= 2 g (1/l MAt-2) 1-x2/(1+x2)2
- minimum: (Pt-1, ytMA)=((1-l)MAt-2, -g)
- maximum: (Pt-1, ytMA)=((1+l)MAt-2, g)
The parameter g controls for the maximum and minimum fraction of wealth the technical trader can invest in the risky asset. The parameter l controls for the location of the extrema. Within some band around the moving average, which depends on the value of l, ytMA increases (or decreases) to a maximum (or minimum) value g (or -g). Outside this band the further away price deviates from the moving average, the more ytMA decreases in absolute value.
|
|
Figure 6.2: Demand function exponential moving average belief
|
6.3.3 Market equilibrium
Wealth per agent, total wealth and market clearing
The number of shares agent j who follows belief h holds in the risky asset at time t depends on his individual wealth and the equilibrium price, that is
Here Wj,t is the wealth of agent j at time t, which depends on the fraction of the wealth invested at time t-1, that is
|
|
| Wj,t= |
| ( |
1+rF+yj,t-1 (rtP-rF) |
) |
Wj,t-1= |
|
| |
ć
ç
ç
č |
1+rF+yj,t-1 |
ć
ç
ç
č |
|
-(1+rF) |
ö
÷
÷
ř |
ö
÷
÷
ř |
Wj,t-1= |
|
| |
| R Wj,t-1 + |
( |
Pt+Dt-R Pt-1 |
) |
|
|
= |
|
| |
| R Wj,t-1 + |
( |
Pt+Dt-R Pt-1 |
) |
zj,t-1. |
|
|
(28) |
|
|
| Wt= |
|
| |
| R |
|
Wj,t-1 + (Pt+Dt-R Pt-1) |
|
zj,t-1= |
|
| |
R Wt-1 + (Pt+Dt-R Pt-1) s = |
| |
R (Wt-1-s Pt-1) + s Dt + s Pt, |
|
(29) |
|
|
| Wt= |
| Rt (W0-s P0) + s |
|
(Ri Dt-i) + s Pt = |
|
| |
| (W0-s P0) + |
|
|
( |
Ri (rF (W0-s P0)+s Dt-i) |
) |
+ s Pt . |
|
|
(30) |
We assume that at time t each of the N agents hands over his demand function (6.27) for the risky asset to a market auctioneer. The auctioneer collects the demand functions and computes the final equilibrium price Pt so that the market clears. Equilibrium of demand and supply so that the market clears yields
|
|
|
|
zj,t =
|
|
|
ć
ç
ç
č |
|
zj,th |
ö
÷
÷
ř |
=s.
(31) |
|
|
|
|
ć
ç
ç
č |
|
|
|
ö
÷
÷
ř |
=
|
|
|
ć
ç
ç
č |
|
|
|
Wj,t |
ö
÷
÷
ř |
=
|
|
|
ć
ç
ç
č |
|
ö
÷
÷
ř |
=s, |
|
|
|
(32) |
The heterogeneous agents model equilibrium equation
Now that we have shown that the fraction of total market wealth invested according to a certain belief converges in probability to the probability that the belief is chosen, we can solve equation (6.32) for Pt to get the equilibrium price. Equilibrium equation (6.32) can be rewritten as
|
|
ć
ç
ç
č |
|
|
ö
÷
÷
ř |
|
|
|
|
ć
ç
ç
č |
|
ö
÷
÷
ř |
=s |
|
, |
| S(Pt)= |
| Pt |
|
| R |
ć
ç
ç
č |
|
-Pt-1 |
ö
÷
÷
ř |
+Dt+Pt |
|
|
. |
Recall that for the utility maximizing agents the demand as a fraction of individual wealth, yth, in (6.24) is a decreasing function of Pt. For the non utility maximizing agents yth does not depend on Pt, but only on past prices. Hence the left hand side of equilibrium equation (6.34) is a decreasing function of Pt. Although the right hand side of (6.34) is an increasing function of Pt, some additional restrictions for the demand of the non utility maximizing agents must hold for a unique positive equilibrium price to exist. This will be shown in the next section.
The equilibrium price
We split the set of beliefs or forecasting rules the agents can choose from in a set B1 of utility maximizing beliefs based upon price predictions and the set B2 of non utility maximizing beliefs, not using price predictions but technical trading strategies. Equation (6.34) can then be rewritten as
|
|
|
|
qth yth + |
|
qth yth = |
|
.
(35) |
If the supply of outside shares is equal to zero, i.e. s=0, then substituting (6.24) in (6.35) to solve for Pt yields
Several assumptions have to be made for the equilibrium price to exist. First we have to assume that there is a belief h Î B1 for which qth>0. If for all beliefs h Î B1: qth=0, then there is no solution for Pt. Further, for the equilibrium equation to be solvable for Pt an upperbound has to be posed on the fraction of total market wealth the technical traders in B2 can go long in the risky asset. If s=0, then according to equilibrium equation (6.35) the fraction of total market wealth traders in belief group B2 go long is equal to the fraction of total market wealth traders in belief group B1 go short, that is
Because of the characteristics of the demand function (6.24) for the risky asset, traders in belief group B1 are restricted in the fraction of individual wealth they can go short, that is
This implies that there is an upperbound on the fraction of total wealth traders in belief group B2 can go long, that is
|
qth yth = - |
|
qth yth < |
|
|
|
qth. |
The derivation of the equilibrium price for a strictly positive supply of outside shares, i.e. if s>0, is presented in Appendix C.
The EMH benchmark with rational agents
In a world where all agents are identical, expectations are homogeneous and all traders are risk neutral, i.e. a Ż 0, equilibrium equation (6.36) in the case of s=0 and equilibrium equation (6.61) in the case of s > 0 both reduce to
This arbitrage market equilibrium equation states that today's price of the risky asset must be equal to the sum of tomorrow's expected price and expected dividend, discounted by the risk-free interest rate. The arbitrage equation (6.37) can be used recursively to derive the price at time t
If the transversality condition
holds, which means that the long run growth rate of price is less than the discount rate rf, then the price is equal to the net present value of all future dividends
This price is called the efficient markets hypothesis (EMH) fundamental rational expectations price, or fundamental price for short.
We will focus on the case where for all beliefs h expectations on dividend are equal: Eth(Dt+1)=Et(Dt+1) and where the dividend process is iid with mean D. The fundamental price is then constant and equal to
6.3.4 A heterogeneous agents model with fundamentalists
versus moving average traders
Utility maximizing belief: the fundamental trader
Fundamentalists expect that prices return to the fundamental value with speed v, that is
Etfund(Pt+1)=P*+v(Pt-1-P*), 0Ł v Ł 1.
If v=1, then the fundamental traders make naive price expectations and if v=0, then the fundamental traders expect the price to be always equal to the fundamental value. The fraction of individual wealth invested in the risky asset is then equal to
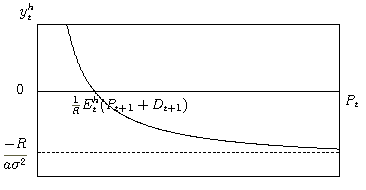
where a>0, s2>0 and R=1+rf>1.
Non utility maximizing belief: the exponential moving average trader
Moving average traders buy (sell) if the price crosses the moving average from below (above). We use the exponential moving average MAt=µ Pt + (1-µ) MAt-1, where the exponential smoothing constant 0<µ<1. The fraction of individual wealth invested in the risky asset is then equal to
|
ytma = 2 g |
|
,
where
xt+1= |
|
|
|
,
g>0 and l>0.
|
6.3.5 The dynamical system
Using equations (6.36), (6.25) and (6.52) and setting MAt=MAt-1 and Fth=Ft-1h the following dynamical system for s=0 is obtained
- 0.1cm
Pt(Pt-1, MAt-1, Ftfund, Ftma);
- MAt=µ Pt-1 + (1-µ) MAt-1;
- Fth=rF + yt-2h (rt-1P-rF) + h Ft-1h, for h=(fund, ma).
Introducing new variables Pi,t-1=Pt-i and MAi,t-1=MAt-i the following eight dimensional dynamical system is derived from the above equations
- 0.1cm
P1,t=qtfund/qtfund R - a s2 qtMA ytMA (P*+v(P1,t-1-P*)+D);
- P2,t=P1,t-1;
- P3,t=P1,t-2=P2,t-1;
- MA1,t=µ P1,t-1 + (1-µ) MA1,t-1;
- MA2,t=MA1,t-1;
- MA3,t=MA1,t-2=MA2,t-1;
- Ftfund=rF + yt-2fund (P1,t-1+Dt-1/P2,t-1-R)- Cfund + h Ft-1fund;
- Ftma=rF + yt-2ma (P1,t-1+Dt-1/P2,t-1 -R)- Cma + h Ft-1ma,
where
- 0.1cm
Dt=D+dt; dt ~ N(0, sd2);
- P*=D/rF;
- qtma=1-qtfund , qtfund=mfund+(1-mfund-mma) qtfund,
- qtfund=exp(b Ftfund)/exp(b Ftfund)+exp(b Ftma);
- ytma=2 g xt-1/1+xt-12 , xt-1=1/lP1,t-1- MA1,t-1/MA1,t-1;
- yt-2fund=1/Pt-2(P*+v(Pt-3-P*)+D)-R/a s2=1/P2,t-1(P*+v(P3,t-1-P*)+D)-R/a s2;
- yt-2ma=2 g xt-3/1+xt-32 , xt-3=1/lPt-3- MA1,t-3/MA1,t-3=1/lP3,t-1- MA3,t-1/MA3,t-1.
Here mfund and mma are the minimum probabilities with which the fundamental and moving average forecasting rule are chosen; see Appendix B for details. The parameter set is given by
|
|
| Q={ |
a>0, s2>0, R>1, b>0, 0Ł vŁ 1, 0<µ<1, g>0, |
| |
l>0, 0Ł h Ł 1, mfundł 0, mmał 0, 0 Ł mfund+mma Ł 1, |
| |
Cfundł Cma ł 0 }. |
|
| qtfund-qtma=(mfund-mma) + (1-mfund-mma) tanh |
ć
ç
ç
č |
|
( |
Ftfund-Ftma |
) |
ö
÷
÷
ř |
. |
Note that
|
|
|
|
P1,t=
|
|
P1,t =
|
|
P1,t=
|
|
P1,t=
|
|
Etfund(Pt+1+Dt+1).
(39) |
We define the vector variable zt=(P1,t, P2,t, P3,t, MA1,t, MA2,t, MA1,t, Ftfund, Ftma)'. In the following we denote the dynamical system by F, where zt=F(zt-1).
Additive dynamic noise can be introduced into the system to obtain zt=F(zt-1) + et, where et=(et, 0,0,0,0,0,0,0)' are iid random variables representing the model approximation error in that our model can only be an approximation of the real world. Because we assumed for all beliefs
| Vth(rt+1P)=Vth |
ć
ç
ç
č |
|
ö
÷
÷
ř |
=s2 |
Vth(Pt+1)=Pt2 s2 - Vth(Dt+1)=Pt2 s2 - sd2.
Therefore, when we add dynamic noise to the deterministic skeleton, we draw et iid from a normal distribution with expectation 0 and variance set2=Pt2 s2 - sd2.
6.4 Trading volume
In this section we describe a procedure to determine trading volume. The total number of short or long positions transferred from belief b to belief h at time t converges in probability to zt-1b qth as the number of agents, each having zero market power, converges to infinity. The total number of long and short positions transferred to belief h from the other beliefs converges then in probability to
|
|
| #longt(® h) |
|
|
|
zt-1b qth I(zt-1b ł 0); |
|
| #shortt(® h) |
|
| |
|
zt-1b qth I(zt-1b<0) |, |
|
|
(40) |
|
|
| if zth>0 then Volth=|zth-#longt(® h)| +|#shortt(® h)|; |
| if zth<0 then Volth=|zth+#shortt(® h)|+|#longt(® h)|; |
| if zth=0 then Volth=|#longt(® h)|+|#shortt(® h)|. |
|
(41) |
6.5 Stability analysis
6.5.1 Steady state
For the system to be in the steady state it is required that the memory parameter is restricted to 0 Ł h <1, thus we assume finite memory. A variable x at its steady state will be denoted by x. A steady state for the map F is a point z for which F(z)=z. Hence in the steady state
MA=µ P + (1-µ) MA, implying P=MA. Furthermore, P=MA, implies yMA=0 and hence Fma=rF-Cma/1-h. Thus the steady state price of the risky asset is equal to the steady state exponential moving average of the price. This relation implies that the steady state demand of the moving average belief is equal to zero.
The steady state price must satisfy P=1/R(P*+v(P-P*)+D), where P*=D/rf is the fundamental price. This implies that P=P*, yfund=0 and Ffund=rF-Cfund/1-h. As for the moving average belief, also the steady state demand of the fundamental belief is equal to zero.
In the steady state the difference in probability with which both beliefs are chosen is equal to
| qfund-qma=(mfund-mma) + (1-mfund-mma)tanh |
ć
ç
ç
č |
|
(Cfund-Cma) |
ö
÷
÷
ř |
. |
|
|
| qfund= |
|
ć
ç
ç
č |
1+ (mfund-mma) + (1-mfund-mma) tanh |
ć
ç
ç
č |
|
(Cfund-Cma) |
ö
÷
÷
ř |
ö
÷
÷
ř |
, |
|
| qma =1-qfund. |
|
6.5.2 Local stability of the steady state
The local behavior of the dynamical system zt=F(zt-1) around the steady state z is equivalent to the behavior of the linearized system
| (zt-z)= |
|
˝
˝
˝
˝ |
|
(zt-1-z) = J (zt-1-z), |
A straightforward computation shows that the Jacobian matrix of F at the steady state z is equal to
|
|
| J= |
é
ę
ę
ę
ę
ę
ę
ę
ę
ę
ę
ę
ë |
|
0 |
0 |
|
0 |
0 |
0 |
0 |
| 1 |
0 |
0 |
0 |
0 |
0 |
0 |
0 |
| 0 |
1 |
0 |
0 |
0 |
0 |
0 |
0 |
| µ |
0 |
0 |
1-µ |
0 |
0 |
0 |
0 |
| 0 |
0 |
0 |
1 |
0 |
0 |
0 |
0 |
| 0 |
0 |
0 |
0 |
1 |
0 |
0 |
0 |
| 0 |
0 |
0 |
0 |
0 |
0 |
h |
0 |
| 0 |
0 |
0 |
0 |
0 |
0 |
0 |
h |
|
ů
ú
ú
ú
ú
ú
ú
ú
ú
ú
ú
ú
ű |
|
|
.
|
|
|
| p(x)= |J-x I|= |
| x4 (h-x)2
|
ć
ç
ç
č |
x2-( 1-µ + |
|
+ |
|
|
)x +
(1-µ) |
|
+ |
|
|
|
ö
÷
÷
ř |
. |
|
|
(42) |
|
x1+x2=1-µ + |
|
+ |
|
|
and
x1 x2=(1-µ) |
|
+ |
|
|
,
(43) |
(x-x1)(x-x2)=x2-(x1+x2)x + x1 x2.
(44)
Also note that because memory cannot be infinite in the steady state (i.e. 0 Ł h <1), the stability of the steady state is entirely determined by the absolute values of x1 and x2. Furthermore, if there is no difference in costs between implementing the fundamental or moving-average strategy, that is Cma-Cfund=0, then qma and qfund are independent of the intensity of choice parameter b and hence the local stability of the steady state of the heterogeneous agents model is independent of b.
We have seen in (6.39) that if the risk aversion, a, or if the expected dispersion of the return of the fundamental belief, s2, goes to zero, then the equilibrium price is entirely determined by the fundamental belief. Now, using (6.42), we find
|
|
|
|
p(x) = |
|
p(x)=x4 (h-x)2 (x- |
|
) (x-(1-µ)),
(45) |
6.5.3 Bifurcations
A bifurcation is a qualitative change in the dynamical behavior of the system when varying the value of one of the parameters. Bifurcations occur for example, if one of the eigenvalues of the linearized system in the steady state crosses the unit circle. We are now going to investigate local bifurcations of the steady state.
Eigenvalue equal to 1
If one of the eigenvalues crosses the unit circle at 1, a saddle-node bifurcation may arise in which a pair of steady states, one stable and one saddle, is created. Another possibility is that a pitchfork bifurcation arises in which two additional steady states are created. The only possibility for an eigenvalue to be equal to one is that one of the solutions, xj, of the quadratic polynomial in (6.44) is equal to 1, say x2=1. Then it follows from (6.43) that
|
x1+1=1-µ + |
|
+ |
|
|
and
x1=(1-µ) |
|
+ |
|
|
.
|
R=v.
However, since 0 Ł v Ł 1 < R, this condition can never be satisfied. Hence eigenvalues equal to 1 can never occur.
Eigenvalue equal to -1
If one of the eigenvalues crosses the unit circle at -1, a period doubling or flip bifurcation may arise in which a 2-cycle is created. Under the assumption that x2=-1, equations (6.43) lead to the relations
|
x1-1=1-µ + |
|
+ |
|
|
and
-x<1=(1-µ) |
|
+ |
|
|
.
|
|
l (µ-2) (R+v) = 4 a g s2 |
|
.
|
Two complex conjugate eigenvalues of modulus 1
If a pair of complex conjugate eigenvalues crosses the unit circle in the complex plane, a Hopf or Neimark-Sacker bifurcation may arise in which an invariant circle with periodic or quasi-periodic dynamics is created. The roots x1, x2 of the characteristic equation are complex conjugate of modulus 1 if x1 x2=1 and |x1+x2|<2. Using (6.43) this leads to the conditions
|
(1-µ) |
|
+ |
|
|
= 1
and
|1-µ + |
|
+ |
|
|
|<2.
(46) |
|
|2-µ |
ć
ç
ç
č |
1- |
|
|
ö
÷
÷
ř |
|<2.
|
When solving the first condition for the risk aversion parameter a a Hopf bifurcation occurs given the parameter set {Q} \ a if aH satisfies
| aH= |
ć
ç
ç
č |
1-(1-µ) |
|
ö
÷
÷
ř |
|
|
|
>0 . |
When solving the first condition for the intensity of choice parameter b a Hopf bifurcation occurs given the parameter set {Q} \ b and Cfund>Cma if bH satisfies
where c is defined as
| c= |
| b (1-mma)-mma |
|
| (1-mfund)-b mfund |
|
,with
b= |
ć
ç
ç
č |
ć
ç
ç
č |
1-(1-µ) |
|
ö
÷
÷
ř |
|
ö
÷
÷
ř |
>0. |
When solving the first condition for the memory parameter h a Hopf bifurcation occurs given the parameter set {Q} \ h if hH satisfies
However, because 0 Ł h < 1, there are cases for which no Hopf bifurcation occurs, when varying h and keeping the other parameters constant.
When solving for the expected dispersion in return parameter s2 a Hopf bifurcation occurs given the parameter set {Q} \ s2 if sH2 satisfies
| sH2= |
ć
ç
ç
č |
1-(1-µ) |
|
ö
÷
÷
ř |
|
|
|
>0 . |
When solving for the gross risk-free interest rate parameter R a Hopf bifurcation occurs given the parameter set {Q} \ R if RH satisfies
| RH= |
| 2 a g s2 |
|
| l |
ć
ç
ç
č |
1-(1-µ) |
|
ö
÷
÷
ř |
|
|
|
. |
When solving the first condition for the fundamental belief parameter v a Hopf bifurcation occurs given the parameter set {Q} \ v if vH satisfies
Again however, because 0 Ł v Ł 1, there are cases for which no Hopf bifurcation occurs, when varying v and keeping the other parameters constant.
When solving the first condition for the exponential moving average parameter µ a Hopf bifurcation occurs given the parameter set {Q} \ µ and v>0 if µH satisfies
and where v should additionally satisfy 0<vŁ 1. Now also, because 0 < µ < 1, there are cases for which no Hopf bifurcation occurs, when varying µ and keeping the other parameters constant.
When solving for the moving average belief parameter g a Hopf bifurcation occurs given the parameter set {Q} \ g if gH satisfies
| gH= |
ć
ç
ç
č |
1-(1-µ) |
|
ö
÷
÷
ř |
|
|
|
>0 . |
When solving for the moving average belief parameter l a Hopf bifurcation occurs given the parameter set {Q} \ l if lH satisfies
| lH= |
| 2 a g s2 |
|
| R |
ć
ç
ç
č |
1-(1-µ) |
|
ö
÷
÷
ř |
|
|
|
>0. |
Hence when one of the parameters a, s2, g or l is varied while keeping the other parameters constant, a Hopf bifurcation always arises for some parameter value.
If the Jacobian matrix of F at the steady state z has two complex conjugate eigenvalues, x1=c+di and x2=c-di, then the price series, and therefore also the exponential moving average series, follows a wavelike pattern. For fluctuation close to the steady state the period of the wave is approximately equal to
|
, where tan(q)= |
|
, with c>0, |
6.6 Numerical analysis
In the last section we studied the local stability of the steady state analytically. We determined what kind of bifurcations can occur if the value of one of the model parameters is varied. In this section we study the global dynamical behavior numerically, especially when the steady state is unstable, with the aid of time series plots, phase diagrams, delay plots, bifurcation diagrams and the computation of Lyapunov exponents.
6.6.1 Lyapunov characteristic exponents
The Lyapunov characteristic exponents (LCEs) measure the average rate of divergence (or convergence) of nearby initial states, along an attractor in several directions. Consider the dynamical model zt+1=F(zt), where F is a k-dimensional map. After n periods the distance between two nearby initial state vectors z0 and z0+v0 has grown approximately to ||Fn(z0+v0)-Fn(z0)|| » ||DFn(z0) v0 ||,
where v0 is the initial perturbation vector, DFn(z0) is the Jacobian matrix of the n-th iterate of F evaluated at z0 and ||.|| denotes the Euclidean distance. The exponent l(z0, v0) measuring the exponential rate of divergence has to satisfy
||Fn(z0+v0)-Fn(z0)|| » ||DFn(z0) v0 || = en l(z0, v0) ||v0||. For a k dimensional system there exist k distinct LCEs, ordered as l1 ł l2 ł ... ł lk, each measuring the average expansion or contraction along an orbit in the different directions. The largest LCE can be defined as
|
|
l(z0, v0)= |
|
|
|
ln(||DFn(z0) v0 ||).
(47) |
To calculate the largest LCE we thus have to determine ||DFn(z0) v0 ||. We set the initial perturbation vector v0 with ||v0||=e, where e is some small number. We define
F(zi + vi)-F(zi) » DF(zi) vi = vi+1' = fi+1 vi+1,
(48)
where vi is a perturbation vector on the i-th iterate of F (i.e. zi=Fi(z0)) and fi+1 is a scalar.
We define
|
vi+1= |
|
e, so that ||vi+1||=||vi||=...=||v0||=e.
(49) |
DFn(z0) v0 = DF(zn-1)...DF(z1) DF(z0) v0. Using (6.48) recursively this relation transforms to DFn(z0) v0 = fn...f2 f1 vn.
Because
the LCE in equation (6.47) can be written as
Hence we can confine ourselves to the calculation of
to determine the largest LCE.
Numerically we compute the largest LCE as follows. Given an initial perturbation vector v0, the approximation in (6.48) is used to determine vi+1' for i ł 0, that is
F(zi + vi)-F(zi) » vi+1'. Next we compute the perturbation vector for the i+1-th iterate by using (6.49). The factor fi+1 is computed by using (6.51). Finally, for large n, the largest LCE is computed by using (6.50).
Attractors may be characterized by their Lyapunov spectrum. For a stable steady state or a stable cycle all LCEs are negative. For a quasi-periodic attractor the largest LCE is equal to zero, while all other LCEs are negative. An attractor is called a strange or a chaotic attractor if the corresponding largest LCE is positive, implying sensitive dependence on initial conditions.
6.6.2 Parameter values
In our numerical analysis of the heterogeneous agents model with evolutionary learning we want to choose values for the model parameters which are economically sensible. We assume that there are 250 trading days in one year. The trading interval in our model is 1 day. If we are talking about daily frequencies, then the order of magnitude of percentage price changes is in basis points (1/100 of 1%).
We set the risk-free interest rate to 5% at a yearly basis with daily compounding. Thus rf=0.05/250=0.0002, that is 2 basis points daily. The daily standard deviation of the Dow-Jones Industrial Average during the twentieth century is equal to 1.0830%, which translates to a yearly standard deviation of, if we assume that returns are independently distributed, 1.0830*250 » 17%. We take this number as the standard deviation of the returns, that is s=0.010830. Dividends are assumed to be iid and the mean dividend is set to 50 yearly, paid daily. Hence the fundamental value of the risky asset under the iid assumption is equal to 50/0.05=1000. The standard deviation of the dividend process is set equal to 10 yearly.
We choose the exponential moving average parameter µ to be equal to 0.18. The maximum fraction of individual wealth a moving average trader can go long or can go short in the risky asset we choose to be equal to g=1.25 and occurs when the price deviates from the moving average with 7 basis points (l=0.0007).
The fundamental value expectations parameter v we choose to be equal to 0.99. Because Etfund(Pt+1)=P* + v (Pt-1-P*) , the expected two-day return of the stock price, not corrected for dividends, is equal to
Thus, if the price should decline by 2% to return to the fundamental value P*, then for v=0.99 the fundamental trader expects that the two-day price return is equal to 2 basis points, which corresponds with a one-day price return of 1 basis point.
A broad range of studies, taking into account the full range of available assets, places the degree of risk aversion a for the representative investor in the range of 2 to 4, see for example Friend and Blume (1975), Grossman and Shiller (1981). We set a initially to 4.
Costs for implementing the strategy with fundamental beliefs are higher than the costs for implementing the exponential moving-average strategy. We set the costs of determining the fundamentals to 1 basis point daily (Cfund=0.0001), which is 2.5% yearly. The costs of the moving-average strategy we set to zero.
The discrete choice model determines on the basis of the fitnesses of the beliefs with which probabilities the moving average and fundamental beliefs are chosen by the agents. The memory parameter, h, we choose to be equal to 0.25. We choose the intensity of choice parameter, b, to be equal to 250. The minimum probabilities with which the fundamental belief, mfund, and the moving average belief, mma are chosen, we set equal to 0.01.
6.6.3 Model simulations
Bifurcations
We have seen in equation (6.45) that in the case of risk neutrality of the fundamental traders, i.e. a=0, there is locally always convergence to the fundamental steady state. If a=4, then for b=0 the dynamical system exhibits quasi periodic behavior and no change in the dynamics occurs by increasing b. Only for a<0.456 changes in the dynamical behavior can be observed by varying b. Therefore we set the risk aversion parameter a initially low (0.42), so that the local dynamics around the steady state is dependent on the intensity of choice parameter b.
For a=0.42 figure 6.3a shows the bifurcation diagram with respect to b. A Hopf bifurcation occurs at bH=635. Figure 6.3b shows the corresponding largest LCE plot. Before the Hopf bifurcation occurs the largest LCE is clearly smaller than zero, indicating convergence to the steady state. After the Hopf bifurcation occurred, the largest LCE is close to zero, indicating quasi periodic dynamical behavior. Thus for costs and low risk aversion for the fundamental traders and low intensity of choice for all traders, the price locally converges to the fundamental value. However for high intensity of choice, traders quickly change to the most profitable strategy and the moving-average trading strategy can survive in the market even for low risk aversion of the fundamental traders. Price fluctuations are then driven by the evolutionary dynamics between the two different beliefs.
If the costs for the fundamental traders decrease to zero, then locally when varying b there is always convergence to the fundamental steady state, for low risk aversion. Fundamental expectations then dominate the moving-average strategy. Hence, costs can cause the fundamental steady state to become unstable, even if the risk aversion of fundamental traders is low. In the case of no costs and b=250, figure 6.4a shows the bifurcation diagram with respect to the parameter a, when a is varied between 0.1 and 5. Figure 6.4b shows the corresponding largest LCE plot. At aH=0.456 a Hopf bifurcation occurs and the dynamics shows quasi periodic behavior after the Hopf bifurcation. Hence, if fundamental traders become more risk averse, then even in the no cost case, moving average traders can survive in the market and affect the price by their actions.
We set a equal to 4 and study the local dynamical behavior when varying the exponential moving average parameter µ. To observe a change in the dynamical behavior for the parameter µ we double the parameter l to 14 basis points and we decrease the intensity of choice parameter b to 125. Figure 6.5a shows the bifurcation diagram with respect to µ, if µ is varied between 0.04 and 0.98. Figure 6.5b shows the corresponding largest LCE plot. Remember that by increasing the parameter µ the moving average follows the price series more closely and generates earlier a trading signal when the directional trend in prices changes direction. From the bifurcation diagram and the LCE plot it can be seen that the fundamental steady state becomes locally stable if the technical traders use a very fast moving average (µ>0.82), that is if the technical traders quickly change their trading position if the directional trend in prices changes direction. For lower values of µ the LCE plot is close to zero and thus the dynamical system exhibits quasi periodic behavior.
Price simulations
Figures 6.6a, b, c and d show, given the parameter values in section 6.6.2, the time series plots of the price, return, fraction of fundamental traders and trading volume. The price series plot shows that there is a slow movement away from the fundamental value and a quick movement back. In figure 6.6a price starts below the fundamental value of 1000 and slowly increases with a declining positive return, or stated differently, the price sequence is concave. As price is increasing further and further above the fundamental value of 1000, the fundamental traders go short a larger fraction of their wealth, causing volume to increase as can be seen in figure 6.6d. The fraction of fundamental traders starts below 0.50 and is slowly increasing until the point that stock returns become smaller than the risk-free interest rate. Then the moving average forecasting rule is not profitable anymore and the fraction of fundamental traders increases sharply until approximately 0.56. These fundamental traders cause the price to turn back in the direction of the fundamental value. This change in trend is picked up by the moving average traders and they reinforce the downtrend by holding also short positions in the risky asset. Because as well the fundamental traders as the moving average traders are expecting price to decline, price falls quickly back to the fundamental value in a convex way. However, because the moving average traders are doing better than the fundamental traders, the fraction of fundamental traders declines sharply. Thus, the fundamentalists change the direction of the trend, but the chartists push prices back to the fundamental value. Because a majority of the agents was following the fundamental forecasting rule and already had short positions before the turn in price direction, volume drops sharply after the change of direction in the price trend. As price returns to the fundamental value, agents following the fundamental belief are closing their short positions, while traders following the moving average belief are holding more and more short positions, causing volume to increase. After prices dropped back to the fundamental value, prices keep on declining due to the moving average traders, with negative but increasing returns, so that the price sequence is convex. Volume increases, because traders following the fundamental belief are now holding more and more long positions as price moves below the fundamental value. Then, if the short position held by the moving average traders is not profitable anymore, the fraction of fundamental traders increases sharply turning the downward trend in price to an upward trend in price. The moving average traders detect the change in trend and will change their short position to a long position in the risky asset, causing price to increase back to the fundamental value. Because a majority of the agents was following the fundamental forecasting rule and already had long positions, volume drops sharply after the change of direction in the price trend. The price cycle is thus characterized by a period of small price changes when moving average traders dominate the market and periods of rapid decrease or increase of prices when fundamental traders temporarily dominate the market. Furthermore, volume goes by the prevailing trend as can be seen in figure 6.6d. That is, if the primary trend is upwards, then volume increases. Volume drops during a change in directional trend. Then, if the primary trend is downwards, volume also increases. This is a very important concept in technical analysis and the relation has been shown in many price charts.
Adding dynamic noise to the deterministic skeleton leads to irregular price behavior as can be seen in figure 6.7a. Clearly periods with trending behavior can be identified. Figure 6.7c shows that the fraction of fundamental traders is switching irregular between its lower- and upperbound. Because little autocorrelation, volatility clustering and fat tails are important characteristics of real financial time series, we check our return series for these features. Figures 6.8b and 6.8c show the autocorrelation function plots of the returns and the squared returns up to order 36. Figure 6.8b shows that the return series does not exhibit any serial autocorrelation, which means that price changes are linearly independent. Further, according to figure 6.8c the squared return series does not exhibit any serial autocorrelation, which means that there is no volatility clustering present in the data. The return distribution does show excess kurtosis relatively to the normal distribution (see figure 6.8a). Thus our theoretical heterogeneous agents model only fails in mimicking the feature of volatility clustering.
6.7 Conclusion
In this chapter we have built a financial market model with heterogeneous adaptively learning agents, fundamentalists and technical traders. The model is an extension of the Brock and Hommes (1998) model in that it extends the set of trading techniques the agents can independently choose from with a realistic moving-average technical trading rule. Moving averages are well known and one of the mostly used technical indicators in financial practice and therefore they deserve to be implemented in heterogeneous agents modeling. Furthermore, the model is derived under the assumption of relative risk aversion, instead of absolute risk aversion as in the Brock and Hommes (1998) case.
The model is derived under the assumption of infinitely many agents, who only differ in the forecasting rule they select each period. Under the assumption that each agent has zero market power at each date, that is his individual investment decision will not influence the equilibrium price, it is shown that the fraction of total market wealth invested by all agents according to a certain belief converges in probability to the probability that the belief is chosen by the agents. Under the assumption of zero supply of outside stocks and the use of certain beliefs types it turns out that the price equilibrium formula is exactly the same as in Brock and Hommes (1998), namely that the price is equal to the discounted value of the average expected price and dividends by all agents. Moreover if the moving-average technical trading rule is added to the model, then also risk aversion and expected dispersion of future returns play a role in our model.
In the end, our financial market model is an eight dimensional nonlinear dynamical system. The steady state price is equal to the fundamental value, which is the discounted value of all future dividends. Analytically we derive the eigenvalues of the linearized system and we examine for which parameter values bifurcations occur. It is shown that the system only can exhibit a Hopf bifurcation. We use numerical tools such as delay, phase and bifurcation diagrams, and computation of Lyapunov characteristic exponents to study the local stability around the fundamental steady state. If there is no difference in costs of applying the fundamental or moving-average strategy, then it is found that the intensity of choice parameter, measuring how quickly traders switch beliefs, has no influence on the dynamical behavior. In the presence of costs, if the risk aversion parameter of the fundamental traders is low enough, then these traders always drive prices back to the fundamental steady state for the case the intensity of choice parameter is sufficiently low. For high values of the intensity of choice parameter, even for low risk aversion, quasi periodic price behavior can occur as a consequence of a Hopf bifurcation. If costs of all trader types are set to zero and if more realistic values for the risk aversion parameter are chosen, then fundamental traders are too risk averse to drive prices to the fundamental steady state and the price exhibits quasi periodic behavior. However, if the risk aversion parameter is high and the technical traders use a very fast moving average, which follows the price closely, then the price does converge to the fundamental value.
We study a case in which we choose parameter values that are economically sensible. The solution of the dynamical system is quasi periodic price behavior. Interaction between fundamentalists and technical analysts may thus destabilize the market and lead to persistent price fluctuations around an unstable fundamental steady state. It turns out that fundamental traders change the direction of a prevailing price trend, but that once the direction has changed, the technical traders push prices back to the fundamental value. Moreover it is found that volume goes by the prevailing trend, that is if the primary trend is upwards or downwards, then volume increases, only dropping if a change in the direction of the trend occurs. This is an important concept in technical analysis. Dynamic noise to the deterministic skeleton is added and leads to irregular price behavior. The features of the return distribution of the dynamical system are examined, but it is concluded that although the model generates returns series which show zero autocorrelation and fat tails, the model fails in mimicking the important characteristic of volatility clustering.
Appendix
A. Figures
(a)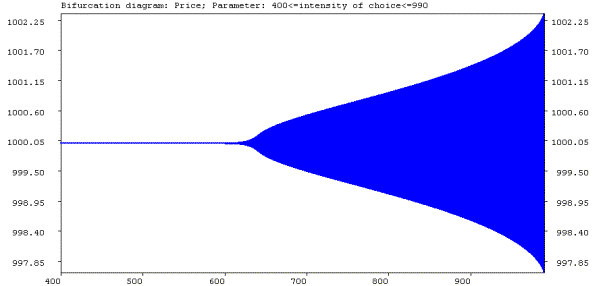
(b)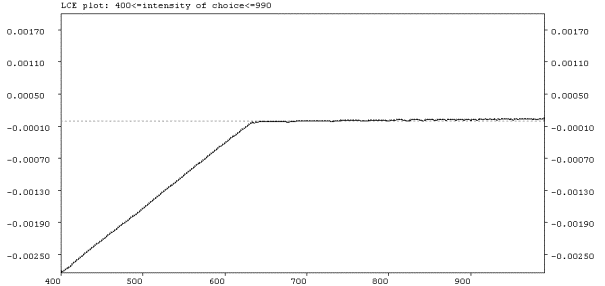
|
|
Figure 6.3: (a) Bifurcation diagram for the intensity of choice parameter b with a Hopf bifurcation leading to quasi-periodic dynamics; (b) largest LCE plot.
|
(a)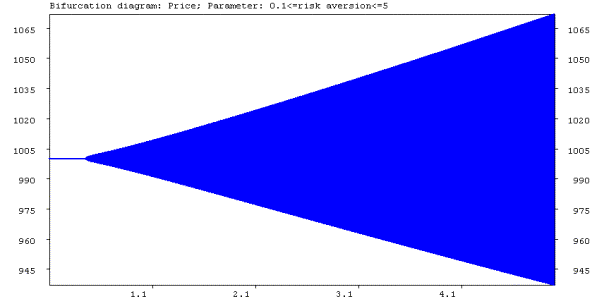
(b)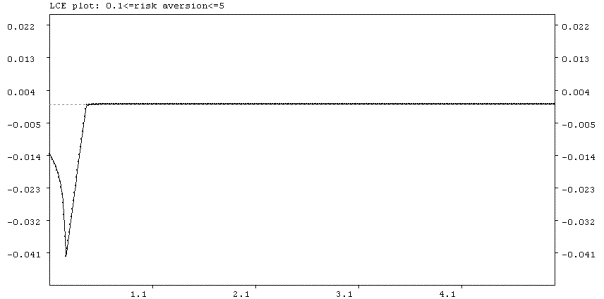
|
|
Figure 6.4: (a) Bifurcation diagram for the risk aversion parameter a with a Hopf bifurcation leading to quasi-periodic dynamics; (b) largest LCE plot.
|
(a)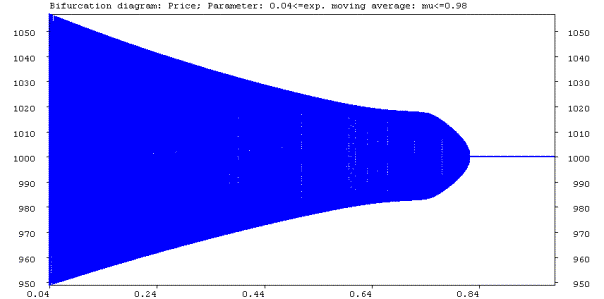
(b)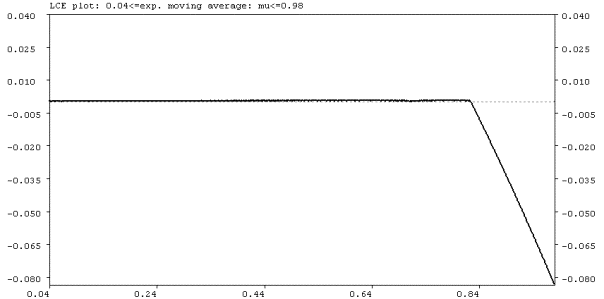
|
|
Figure 6.5: (a) Bifurcation diagram for the exponential moving average parameter µ with a Hopf bifurcation leading to quasi-periodic dynamics; (b) largest LCE plot.
|
(a)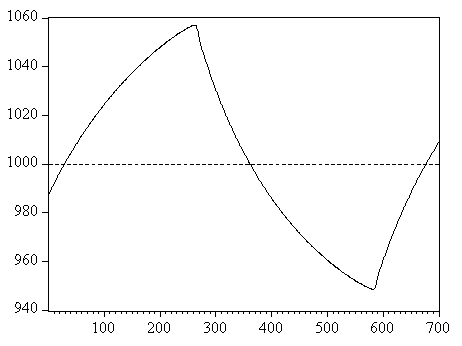
(b)
(c)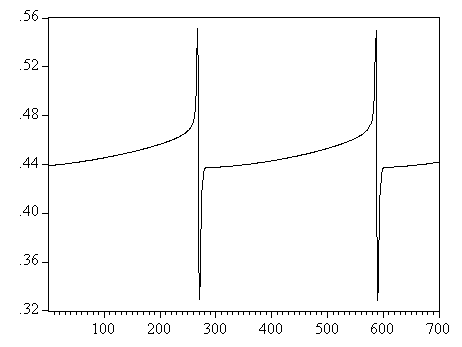
(d)
|
|
Figure 6.6: rf=0.05/250, D=50/250, a=4, µ=0.18, g=1.25, l=0.0007, v=0.99, h=0.25, b=250, mfund=mma=0.01, Cfund=0.0001, Cma=0. (a) Price plot. Dotted line is the fundamental value; (b) Return plot. Dotted line is the risk-free interest rate; (c) Fraction of fundamental traders; (d) Trading volume.
|
(a)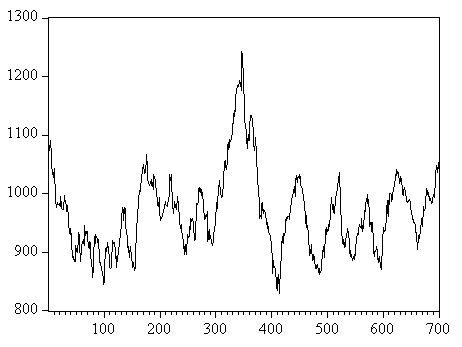
(b)
(c)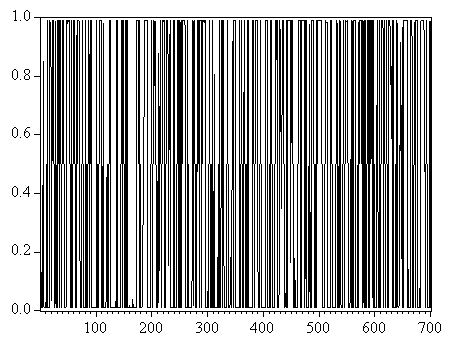
(d)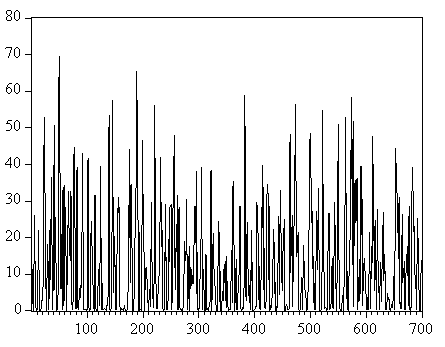
|
|
Figure 6.7: Adding dynamic noise to the deterministic skeleton of the nonlinear financial market model with fundamentalists versus moving average traders: s2=0.17/250, sd2=10/250. (a) Price plot; (b) Return plot. Dotted line is the risk-free interest rate; (c) Fraction of fundamental traders; (d) Trading volume.
|
(a)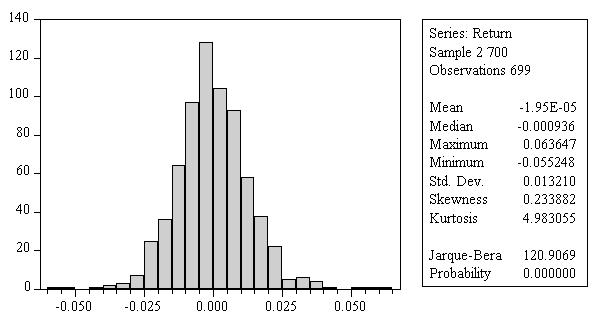
(b)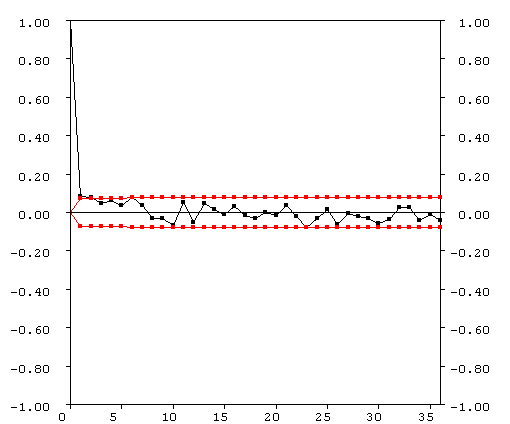
(c)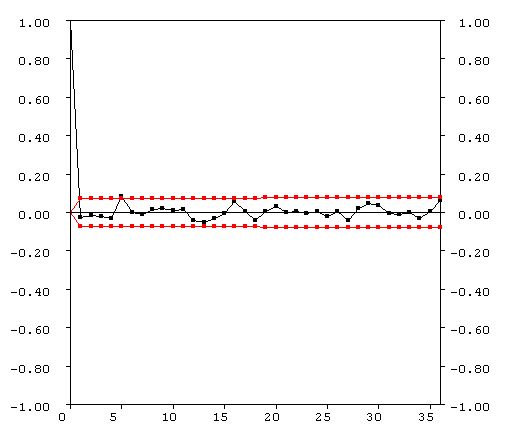
|
|
Figure 6.8: (a) Histogram and summary statistics; (b) Autocorrelation function of the returns; (c) Autocorrelation function of the squared returns.
|
B. Wealth invested according to belief h
Choice probability
The probability that agent j chooses belief h is determined by the discrete choice model in (6.15). The return of belief h in period t is equal to: rF+yt-1h(rtP-rF). Therefore the fitness measure is defined as
Fj,th=rF+yt-1h(rtP-rF) - Cjh +hj Fj,t-1h;
(52)
As in the BH model it is assumed that for all agents bj=b, hj=h and Cjh=Ch. However, we adjust the probabilities with which each belief is chosen by introducing a lower bound mh on the probabilities as motivated by Westerhoff (2002):
where mhł 0 " h and 0 Ł ĺh=1H mh Ł 1.
For example, Taylor and Allen (1990, 1992) found in questionnaire surveys that a small group of traders always uses technical or fundamental analysis and do not switch beliefs3. We define Xj,th=1 if agent j chooses belief h at time t and Xj,th=0 if agent j chooses a belief other than belief h. Because X1,th, ..., XN,th are iid with E(Xj,th)=qth and limited variance V(Xj,th)=qth (1-qth), the fraction of agents who choose belief h converges in probability to qth:
as the number of agents goes to infinity. Furthermore we did assume that all agents have the same risk aversion parameter aj=a, so that agents who follow the same belief have the same demand. Hence in the end we assume that agents are only heterogeneous in the beliefs they can choose from.
Wealth assigned to belief h by agent j
The wealth invested according to belief h by agent j at time t is equal to Wj,th=Xj,th Wj,t. From this it follows that the total wealth assigned to belief h by all agents is equal to Wth=ĺj=1N Wj,th. Finally, total market wealth is equal to Wt=ĺh=1H Wth. The expected wealth transferred from agent j to belief h conditioned on the wealth of agent j and the information set It={Pt-i, Dt-i; ił 0} is equal to:
E(Wj,th|It, Wj,t)=Wj,t E(Xj,th|It)= Wj,t (qth 1 + (1-qth) 0)=qth Wj,t.
The expectation of wealth transferred from agent j to belief h conditioned only on It is equal to:
E(Wj,th|It)=E(E(Wj,th|It, Wj,t)|It)=qth E(Wj,t|It).
According to (6.28) the wealth of agent j at time t depends on the fraction of the wealth invested at time t-1 and this chosen fraction depends on the agent's belief at time t-1. Hence the expected wealth of agent j at time t conditioned on his wealth at time t-1 is equal to:
| E(Wj,t|It, Wj,t-1)= |
|
|
ć
ç
ç
č |
ć
ç
ç
č |
R Wj, t-1 + (Pt+Dt-R Pt-1) |
|
ö
÷
÷
ř |
qt-1h |
ö
÷
÷
ř |
= |
| R Wj, t-1 + (Pt+Dt-R Pt-1) |
|
, |
| E(Wj,t|It)=EWj,t-1(E(Wj,t|It, Wj,t-1)|It)= |
|
E(Wj,t|It, Wj,t-1) P(Wj,t-1)= |
|
R E(Wj, t-1|It-1) + (Pt+Dt-R Pt-1) |
| E(yt-1) E(Wj, t-1|It-1) |
|
| Pt-1 |
|
.
(53) |
| E(Wj,t|It)= |
ć
ç
ç
č |
R + |
|
E(yt-1) |
ö
÷
÷
ř |
E(Wj, t-1|It-1)= |
(1+rF + (rtP-rF) E(yt-1) ) E(Wj, t-1|It-1),
which is a recursive formula for the expected wealth of agent j at time t given the dividends paid and given the equilibrium prices {Pt-i: i ł 0 } the auctioneer did set. Given the wealth of agent j at time 0, the expected wealth of agent j at time t is equal to:
| E(Wj,t|It)= Wj,0 |
|
|
( |
1+rF + (rt-iP-rF) E(yt-1-i) |
) |
. |
|
|
E(Wj,t|It)=w0 |
|
|
( |
1+rF + (rt-iP-rF) E(yt-1-i) |
) |
.
(54) |
The variance of Wj,th conditioned on It is equal to:
|
|
| V(Wj,th|It) |
= |
E((Wj,th)2|It)-E2(Wj,th|It) |
| |
= |
qth E(Wj,t2|It)- (qth)2 E2(Wj,t|It) |
| |
= |
qth V(Wj,t|It) + qth (1-qth) E2(Wj,t|It). |
|
(55) |
E(Wj,t2|It, Wj,t-1)=R2 Wj,t-12+2R Wj,t-12 (rtP-rF) E(yt-1) + Wj,t-12 (rtP-rF)2 E(yt-12),
and the expectation only conditioned on It is equal to:
E(Wj,t2|It)=[R2 +2R (rtP-rF) E(yt-1) + (rtP-rF)2 E(yt-12)] E(Wj,t-12|It-1),
which iterates to:
|
|
E(Wj,t2|It)=Wj,02 |
|
[R2 +2R (rt-iP-rF) E(yt-1-i) + (rt-iP-rF)2 E(yt-1-i2)],
(56) |
E2(Wj,t|It)=[R2 +2R (rtP-rF) E(yt-1) + (rtP-rF)2 E2(yt-1)] E2(Wj,t-1|It-1),
which iterates to:
|
|
E2(Wj,t|It)= Wj,02 |
|
[R2 +2R (rt-iP-rF) E(yt-1-i) + (rt-iP-rF)2 E2(yt-1-i)].
(57) |
|
|
| E(Wj,Th|IT)=qTh RT w0, |
| V(Wj,Th|IT)=qTh (1-qTh) (RT w0)2. |
|
Fraction of total market wealth assigned to belief h by all agents
We define
as the individual wealth assigned by agent j to belief h as a fraction of total market wealth Wt. The choices agents make at time t are dependent on the performances of the different beliefs until and including time t-1, hence the choices are independent of the price and wealth at time t. However, the price set at time t, which influences the wealth of each agent at time t and thus total wealth, is dependent on the choice of each agent at time t. Thus W1,th, ... , WN,th given It are dependent. However, if an agent is very small relative to the market, his choice will have a negligible effect on the eventual price set at time t. Hence if we assume that the market power of each agent is zero, that is
then the law of large numbers still holds. Thus W1,th, ... , WN,th given It are dependent but identically distributed with mean E(Wj,th|It)=qth wt/Wt and finite (under assumption 6.58) variance V(Wj,th|It), so that
This means that the average wealth per agent which is assigned to belief h as a fraction of total market wealth converges in probability to qth wt/Wt as the number of agents goes to infinity. Average wealth per agent as a fraction of total wealth converges to:
If we divide (6.59) by (6.60) we find that the fraction of total wealth invested according to belief h at time t converges to:
C. Equilibrium price for s>0
If s>0, then the derivation of the equilibrium price becomes more complex. By substituting (6.24) and (6.29) in (6.35) we can rewrite (6.35) as the solution to a quadratic equation of Pt. The formulas for the equilibrium price Pt are:
|
|
|
| c2=R(Wt-1-s Pt-1)+s Dt; |
|
|
| Discr=(c1 c3 R s + c2 c3 R - a c2 c4 s2)2 + 4 a c1 c2 c3 R s s2; |
| Pt= |
| (c1 c3 R s-c2 c3R + a c2 c4 s2) + Discr |
|
| 2 s (c3 R + a (1-c4) s2) |
|
. |
|
|
(61) |
| 0 Ł |
|
qth yth + |
|
qth yth < 1, |
| - |
|
qth yth Ł |
|
qth yth < 1- |
|
qth yth. |
|
qth yth <1+ |
|
|
|
qth
, or equivalently c4<1+c3 |
|
|
|
| (c1 c3 R s-c2 c3R + a c2 c4 s2) + Discr > |
| (c1 c3 R s-c2 c3R + a c2 c4 s2) + (c1 c3 R s + c2 c3 R -a c2 c4 s2)2= 2 c1 c3 R s > 0. |
|
- 1
- Henceforth abbreviated as BH.
- 2
- However, if Ftma-Ftfund becomes large which causes qtfundŻ0, this can cause numerical problems in computing the market equilibrium price, because of floating point errors in the computer simulations. These problems are avoided by placing a lower bound mfund>0 on the probability with which the fundamental belief is chosen.
- 3
- Moreover, especially in our final two type trader model, by placing a lower bound on the probabilities, we can avoid numerical problems in computing the market equilibrium price, because of floating point errors in the computer simulations.
|


