

![]()
![]()
![]()
![]()
![]()
![]()
![]()
![]()
![]()
|
Unit
|
Jan - Dec 2002
|
Jan - Aug 2003
|
|||||||
|
US$000
|
% Change
|
Qty
|
% Change
|
US$000
|
% Change
|
Qty
|
% Change
|
||
| Toy |
-
|
5,574,631
|
7.9
|
-
|
-
|
3,563,456
|
6.7
|
-
|
-
|
| Video games |
10,000
|
2,492,921
|
178.1
|
16,602
|
10.9
|
1,375,752
|
36.8
|
9,972
|
0.2
|
| Articles for Christmas festivities |
-
|
1,038,481
|
21.8
|
-
|
-
|
737,050
|
16.9
|
-
|
-
|
| Football, basketball, volleyball |
10,000
|
104,074
|
34.8
|
8,277
|
53.0
|
86,281
|
15.4
|
6,741
|
15.2
|
Source: China Customs Statistics
Note: Further detailed statistics are available from China Customs Statistics
Information Service Center.
Hong Kong 's Export of Sporting Goods
The statistical figures of the sporting goods are shown
below:
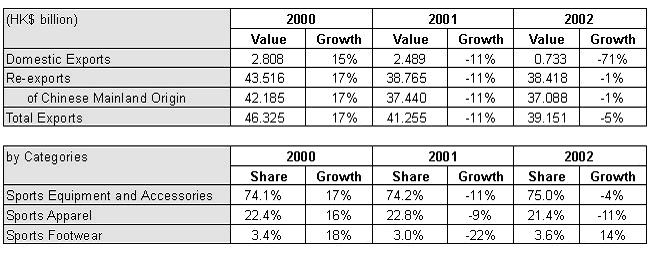
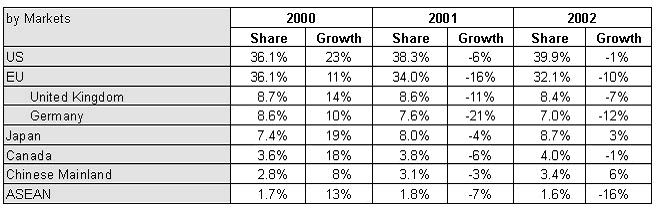
Total exports of sporting goods dropped by 5% in 2002. Exports to the US, the
largest market for Hong Kong sporting goods exports, fell by 1%. Exports to
Japan increased by 3%, while exports to other major markets such as the UK and
Germany dropped by 7% and 12% respectively. In terms of product categories,
exports of sports equipment and accessories and sports apparel dropped by 4% and
11% respectively in 2002, while exports of sports footwear increased by 14%.