
|
Kumasi Polytechnic Dot Net
Gold Cocoa Timber and Currencies, Trend Trading Course |
|
|
| |
|
How to Trend Trade
This site is intended for those who are hanging on to the end of an old piece of
copper wire, or are using low cost narrow bandwidth internet cafes. Focus is
on keeping overhead and operating costs to a very low level in order to
convert weaknesses into assets and enable profitable trading of a kind impossible for heavily
encumbered city slickers in WallSt/London/Tokyo. Put another way, if your
overhead trading costs per day total less than one Euro, then in the land of
75 cents per day statutory minimum wage, you can live comfortably on a gross
profit that the fat cat couldn't survive on. If any content doesn't load
cleanly and quickly, then send a message about it via front page Yahoo
Messenger link and remedial action will be taken.
Where to begin? Answer, with Yahoo finance
for essential information. Why? One, because it's always there - you can
safely bet your shirt that if it isn't available to you, then your local service provider is at fault. Two, it's
free - you can buy extras like real-time data if you like and can afford it, but you can also do
without as a trend trader. Three, from the beginning, Yahoo material has been
designed to be lean and quick loading - exactly what you want if you don't
enjoy inexpensive or can't afford expensive broadband. If you find any
course material (some charts for example) to be too 'big' for your connection,
then yep you've guessed it, use the front page Yahoo Messenger link and
remedial action will be taken when time and other resources permit.
|
| You can also use K-Poly material like the
charts here, and here
(incl.the curiosity EU/cedi)
unaltered, or you can modify the simple code to suit your particular
purpose in your web space at : kumasipolytechnic.net/your-identity. Next thing you need is a trading account -
one such account is a "CFD" account. A
CFD account can be opened for as little as a couple of hundred pounds or
dollars and offers high 'leverage', even on a small account. It isn't our
business to advertise particular brokers so do a web search and select one
that does *not* charge a commission per transaction.
Remember that if you don't have the necessary few hundred USDs to put a
toe in the water, then you can pool your resources with others in a
village/club/family/workplace account. You can also open an equity trading
account for a few hundred USDs with an online broker to trade
Exchange Traded Funds
GLD,
QQQ,
DIA,
SPY, for more information
about Exchange Traded
Funds (ETF - QQQ
for the Nasdaq 100, DIA for the DOW SPY for the S&P 500, and
GLD for gold) please click
on each to get explanation, we have to move on. If you run into any
insurmountable obstacles then communicate about it and we'll see
what can be done.
Before putting your money on the table, either 'get head around'
technical analysis, the study of market action (price changes),
primarily through the use of charts, the purpose of which is to 'see'
price trends with a trained perception based on three premises:
1. that
market action reflects
everything;
2. that prices move in trends;
3. that history repeats itself ; we'll go into training and a
necessary toolkit later.
You must also read about world
news and global economic
forces (like the Bush factor - whether or not he's likely to go rampaging around the world like a
nuclear tipped 800 gorilla, or just insult an independent nuclear power like
France, either during the the next trading session or in foreseeable future, for example - because when he does
you can safely bet your best blouse on the fact that there will markets
'fallout', just as there is when money managers Greenspan et al churn out
truckloads of 'funny' money to 'rig' an 'election' and/or debase the US$
in creating a house of cards
illusion of prosperity among an obese population of highly trained Pavlovian "consumers").
|
| How not to Trend Trade:
End of day 23-02-05 : Despite the expected pull-back in precious metals
the TT club did profit
today 23rd, against the background for PMs outlined above,
in trades typified by this chart
(too big to include in this page). Entry was indicated, after an initial
pull-back that you can see on the
day chart, by a proprietary machine assistant (also being tested by the
TT
club as a generator of advice for fee-paying clients around the globe) had
identified PAAS as the first precious metal miner (of silver in this
instance) to put in
a double bottom, have 23 EMA cross 50EMA positively, and have +DI
positively cross -DI supported by a strong ADX and other indicators all
visible on
this chart.
Next day 24th, to illustrate the near chaotic element of global
markets, AAUK (Anglogold) is well down on yesterday's close since the
publication of US unemployment numbers (can you believe it? they
actually count their obese unemployed!) and is still falling pre-market at 0800 hrs NY
time despite still positive money flow numbers - what's up?....
manipulation by a cartel of the big finance houses?... well all we can
say for sure is that if it is then it's selective because PAAS is up
pre-market on yesterdays close and still looking good - this was an
illustration in real-time, of the decision-making processes of the
appropriately trained brain ........ however,
you should by now have a clear picture of the alternative to trend
trading - it *is* possible and *can be* profitable, but more often than
not, unless extraordinarily lucky or skilled, you can easily end up back at square one, or worse....... y'see, PAAS *did*
plummet today and partly recover, etcetera.... what did the TT club do
with their PAAS position? Well it was decided that the commitment had been
small enough and the longer term trend appropriate to ride out the draw-down ('draw-down' is another important another topic to be
covered later) due to volatility. Update Friday closing : the TT club
elected to close the PAAS position for the weekend, because PAAS put in
what's called a 'double top' (prices: 17.133, 17.13. First
'top' 27 hours ago, second 'top' about 1 hr before close). Within
minutes of TT club closing the position sure enough PAAS tanked through
the 200 EMA.
That means a lot of other traders made the same decsiion, or followed suit.
Either way :
1. Being among the first out, paid a small profit;
2. it was a nice example of crowd/herd behaviour in real-time;
3. it was also a nice example of how NOT to conservatively trend
trade. Until you can profitably 'do' trend trade transactions, over and
over again, only a mug would dabble in the TT club game;
4. it was an example of decision-making freed from
commission costs, that's given by an appropriate commission free CFD
trading account - one of the significant operating costs especially to a
micro trader, is a typical 10 $ or � commission fee paid to the
facilitating online broker for each transaction whether it involves 10
or 10 thousand shares. It's an insignificant cost on a 100 thousand $/�
transaction, but a significant one on a 200 �/$ or even 100 $/� micro
trader's transaction.
In this paper, the author tells
about an aspect of brain development - another well researched one is
the identified difference between a 'normal' brain and the brain of a
London cab driver after years of 'doing the knowledge' (intensive
focussed training). With training, the average human brain can develop
to interpret numerous almost chaotic, simultaneous real-time signals
generated by varying trade-related phenomena and semi-processed by
computing technology. Action research is showing what big finance houses
have known a long time, that that ability can be
seriously enhanced by application of additional computing technology that
can deal with the bottleneck imposed by the number of simultaneous or
concurrent information streams that the human brain can cope with
effectively. Computing technology can 'scan' and calculate at far
greater speed and with far greater accuracy than the human brain.
Finance houses have always relied on such systems, now because of recent
progress, you can inexpensively use the technology too and
we'll go into detail in a later paper.
However, if you and your sophisticated tools stand too close
to the near 'chaos', you can both, jointly and severally lose ability to
spot your friendly trend through the 'noise'. Better to take the longer
term view. One time-scale is illustrated by these current charts.
What to do if you, with or without perception enhancing tool(s) can't *see* a trend? Then stay out of the market!
At the end of this first week of the trend-trading course, it may be
difficult to 'see the wood for the trees' . Dealing with the confusion
of new concepts and ideas is helped by studying each of the concepts
highlighted by bold type or hyperlinkage over the weekend.
Update 28-02-05 : HA! HA! HA! 30 mins before main US markets open
you'll be able to guess what the TTClub have done? Yep they've gone back
into PAAS - d'you *now* see the advantage of taking a step back and
trend trading at 'arms length' with a long enough time-scale as your
'window' of perception??? Me? I think AAUK
55% owner of AU an 'owner' of Asante minerals
is going great guns - better than PAAS as a beneficiary of low operating
costs and taxes.
Update 14-03-05 : On the other hand, though it's an aspect of
trend trading (trading the within-trend volatility) that we haven't
covered yet, let's watch this as a real-time example and see how it plays
out : the
TT club re-entered PAAS
today after covering a
short position for the
duration of a small within-trend pull-back, that aggressive trader also
covered some equally short-term short
sold
XAU call option contracts at the
same time (phew! and today 16th sold PAAS as VZZAD, an 2007 option
contract bought 14th at 3.1, at 3.4 - hey! that's seat of the pants
stuff, it is *not* trend trading - hang on, it gets better today the
16th, whoever was buying VZZAD earlier has dropped out and as one would
expect, market makers are pulling underlying PAAS down for the contracts
expiry date on Friday of this week, so the TT club have placed an order
to buy back again at 3.1 - nice trading if you can get it, up, down, up,
down, in again and up again when the Market Makers pull PAAS down for contracts
expiry date the 19th, all done profitably in the same instrument in one
week) but we inveterate trend traders and fledglings, in
teaching/learning mode, are still watching that metal to miners ratio
for an entry (to miners' stocks index XAU)
signal. We got a positive cross of -DI and +DI, but ADX continued to
trend southwards and sure
enough
XAU tanked temporarily in the nice kind of pullback that is a
healthy indication that the uptrend is still in place.
The question in
the air today 15th, is whether XAU, having reached
this
uptrendline, will continue
southwards to
this one... in
that chart,
MACD suggests that it won't but chart of price relative to the metal
shows that it easily could within the long-term uptrend. We shall see,
and wait! A pull-back to lower support level would likely present us
with the perfect entry point signal set. We'll see, and wait - this
module is about conservative trend trading - not daytrade scalping, and
this strand is about timing entry to a miners' stocks index (XAU) not
the metal, though it should be noted that the metal is also at this time
in healthy pull-back mode, as
indeed is individual miner AAUK
(majority owner of AngloGoldAshanti). Update 16th : we can expect miners
to recover after options contracts expire Friday the 18th.
That's our
provisional entry target date and we're not emulating the IT club, entry
will be confirmed by the required signals, or else it won't happen, so
watch this space. You can watch developments from this grandstand
('save' the page to your desktop and open it
there, with java enabled and appropriately configured IE browser - if you normally use Firefox then open
it with IE which you should also have installed for
certain purposes).
Update on option contracts
Expiration Date (the third Friday of the third
month of every quarter) 18th : There aren't any options on AAUK so it's
already been rebounding for the past three days, but 'big' mining stocks like NEM
will be held down by Market Makers today and should take off next week
- that in turn will drive our target instrument, XAU,
but not today.
Update PM : there goes the TT Club's ZZAD order (a PAAS option
contract) - marketpic captured 16.24 CET :
| Pan American Silver Corp (PAAS) |
At
10:24AM ET 180305: 16.680.05 |
|
|
View By Expiration:
Mar 05
| Apr 05
| May 05
| Jul 05
| Oct 05
| Jan 06
| Jan 07
| CALL OPTIONS |
Expire at close Fri, Jan 19, 2007 |
|
You have to admit that the above is a
pretty cool real-time demo by The TT Club,
of your future ability to make money - when fully
developed. Lets keep the
arithmetic simple and call it 20 contracts in the same instrument, VZZAD,
long and short twice in one week (and on the way up again to be sold again
when a worthwhile profit level is reached thanks to within uptrend volatility) at $35-$45
each contract each leg (of 4 up & down), that's a total of $3k plus a lot more than
operating costs which within the deliberately low cost Kpoly scheme of
things would amount to $40 total in brokerage commissions plus less than
half the same amount to cover all other operating costs (because you the
independent trader are paid by profit only) even if there were no other trades within that week to
share the burden. With a maximum working capital commitment at any time
(if '
margin' is not used) of approx $9k (and a lot less if 'margin' used),
let's call it therefore a minimum net profit of 33% on one instrument in one week -
not bad compared with cocoa farming or a slave labouring in a goldmine in
the land of the $1 a day national minimum wage. If that amount of capital
wasn't available then there would have been, on just 3 contracts using
less than $1k capital, an approaching 30% return after paying expenses,
without using
margin.
Got the message ? |
|
Getting back to 18-03-05 tuition - GLD
(the metal ETF) is rising nicely
now that it's relieved of pressure from MT's , that's a good
indication of a positive week in metals and miners stocks. However, if
markets were that easily predicted you wouldn't need
developmental tuition/training, so wait for the right signals
set for the markets segment we are watching - gold/silverminers index, XAU.
There is awareness that this 'howto' page has been neglected recently
and is reproducing stuff from the real-time action research page here. This is
being dealt with - probably by rewriting 'howto' when time (available to
unpaid volunteer(s)) permits. This does NOT mean that free education is
inferior education - quite the opposite, because unlike this kind of bought pseudo-education for example, it is free of both 'aid'
and other corrupting pressures, meaning that within resource constraints your tutor prioritises *your*
development above all else.... watch this space.
Update 21-03-05 : We are today seeing gold metal plunge $10 before
recovering a little. This is a nice and timely illustration of the kind
of volatility and drawdown you have to be able to survive as a trader.
If in the market, you *might* have foreseen this outcome of large Asian currency players being out of the markets (and the
knock-on $ effect on metal), and might have foreseen the the aggravating beginning of extended
Easter vacation when many traders and money managers are out of the
market because starting their Easter break - or you might not. In either
event you have to have ability to survive this kind of draw-down built
in to your trading strategies. Trend traders who are watertight in the
face of draw-down,
should take a day or two off for a fishing break until the noise subsides and
we trend traders who are still watching the market for signals of
optimal entry to miners' stocks index XAU, should stay focussed.
A few words on trend trading sub-strategies :
Major market cycles last weeks and months and you may see only one or
two cycle changes in a year, therefore if you select a long term market
'window'/view, timing can be relatively easy. As soon as a long term
cycle turns up, you can �cost average� in, and if different sectors are
going up, then divide, if you wish, your funds equally in each sector.
Cost average means buying over a period of time, depending on how big
your account is. You might buy over a period of two to four weeks about
15 to 20% at a time. Investment vehicles should be an
ETF. Individual
stocks are not recommended unless you have some specialised/insider
knowledge and/or unusual stocks picking skill. Exiting the markets is
the same as entering - as soon as the cycle turns down, begin
liquidation over the next two to four weeks.
Another few words on trading signals : signals trend trading is
different from strategies trend trading, in the that the time-scale can
be very much shorter (signals are typically detected by hourly charts)
and the volatility will be more violent and unpredictable. During a major cycle,
there could be many buy *and* sell signals. Such signals are beneficial
to active/aggressive traders as they trade in and out for short term
profits.
You can of course also do both - and profit or lose from accepting
the challenge of short term trading. You can use some funds for tactical
signals trend trading and some for strategic cycle trend trading.
23-02-05 : XAU Outlook:
After the bloodbath since options expiry Friday (18th), hourly and daily
charts show the miners' index oversold and weekly oscillation bullish. This is
theoretically a good technical position to enter, though as always no
guarantee (if it was that easy there wouldn't be a market because
markets need buyers and sellers) that XAU or the metal have bottomed just
yet. A panic gap down today/tomorrow to the uptrend line would provide the optimal
entry. The following chart shows where we're at in graphical form:

You can see the ABC wave pattern along the uptrend line, see that 'A'
is probably completed and 'B' probably completing (uncertainty is
generated by the unusual speed with which the market was flipped over by
one very large trade at 147k (commercial traders net shorts) in
conjunction with low volume and Greenspan's contribution (all within two
days). Given that this interpretation is correct, then you can also see
that 'C' is always the biggest and fiercest wave - the one most worth
surfing.
Since this page is about 'howto', if unlike the patient people at the
real-time action-research page, you were already 'in' you would in
the above circumstances, after a 'bloodbath' like the past few days
(which you survived by intelligent money planning and avoidance of
over-trading - topics we'll cover later), need an emergency :
Plan
Facts:
cycle is up.
Bullion is a few dollars from major trendline support.
Metal indexes are a couple of points from major trendline support.
Short term charts are extremely oversold with bullish divergences.
Strategy:
You're 100% invested in ETFs and a few stocks.
Assuming stocks are only about 10% of your portfolio, hold them until
major trendline support fails, which would suggest the bull market was over - deal with it if and when.
We should get a sharp bounce soon. When the 15 minute chart is
overbought, then exit half of your ETFs.
Continue to hold the other half of ETFs until the major trendline
support fails, if it does so.
If major trendline support holds, that would suggest wave C is to
begin, therefore revert to 100% invested.
If cycle turns down at anytime, liquidate everything over the next
two weeks without giving them away.
Summary:
You're probably down a small % right now - uncomfortable but
manageable.
If we get a bounce, your risk will be diminished by exiting half and
holding half.
If we go straight down from here, major trendlines will be busted, and
cycle will turn down for sure - your loss using the above plan will likely
be 5% to 10%. Not too bad a scenario and you preserve your capital for
re-entry.
Here we are a couple of weeks later and little changed. You can see
from the following chart that our metal entry point at $414 is still OK,
and from the above chart that 'A' was put in and that we're in the process
of putting 'B' in, and that the leg to 'C' is always the longest and most
vigorous one. About adding to the long metal position, you would hang on a while to
see what happens in this manipulated market, bear in mind anyway that if
there is more draw-down, then that blue MA line, or lower if there is
overshoot, would be a better entry point.

As can be seen from the following chart :
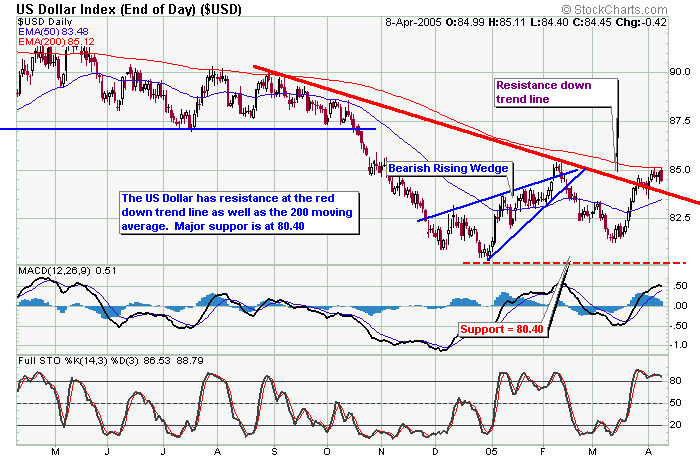
The $index bounced back from 200 EMA resistance. Will the manipulators
allow it to fall back to 50 EMA, or even heavy support line at 80.4, now?
Your guess is as good as mine (providing we're talking about the short
term - longer term the $index is still trending lower because that
(effective heavy devaluation of the $) is what Greenspan et al need, to
help deal with the staggering American trade imbalances without upsetting
trained gluttonous consumers that are the Bush power base.

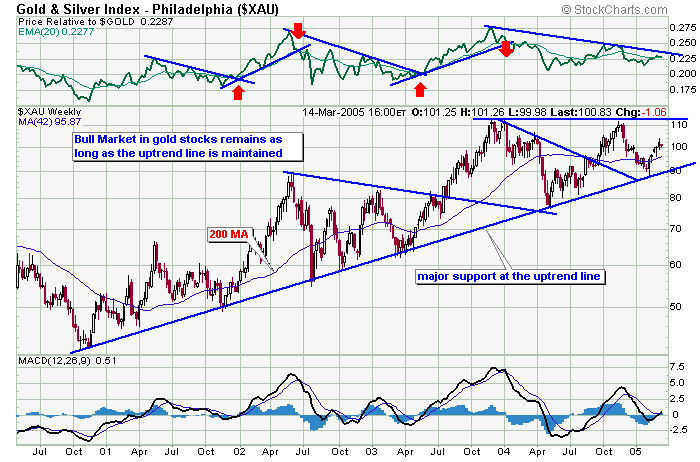
About XAU (miners index)
take a look at this chart.
Do you now see why you would have been waiting for the correct
XAU signals
set before committing resources as trend traders?
A few words about howto trend trade Gold as the metal - it's much easier
(than knocking on the door of the local "Ashanti" mine manager) for the small privateer since the ETF (Exchange Traded Fund) GLD
was introduced. You can now trade it through any broker just like any
stock instrument.

Here's how it's been behaving recently : today, there is a
positive cross of +DI north over -DI, but ADX is weak, volume is
low, and CMF (money flow) is almost non existent.
Aggressive traders might be tempted, but we're trainee canny trend
traders, and we don't move until the odds of a good clean killing are
favourable, so we wait for a better signals set to support the fact that
EMA50 is still the right side of EMA200. We are also aware that the next
upward leg will be 'C', always the roughest/toughest and most profitable
tiger to ride - unless of course there is a trend reversal, in which event
we will close the long metal position entered here,
and retaining the same trend trading strategy, shift to mainly
short
positions to 'play' the downward trend for its duration.
|
| |
|
|
| To be continued. |
| |
| |
|
|
|
|
ng up to a peak around $457..... before the
Katrina debacle, gold was headed for a dip at beginning of Sep before
topping at $457ish in Oct/Nov, but now what? ..... a smoothing of the the
volatility or an ongoing earlier than expected run to $457ish, in company
with a Eur/USD rise to 1.3 plus? ..... Then what? Probably one more tradable
$ recovery and buyable gold dip, before $ secular downtrend and gold secular
uptrend resume in Q 1/2 of '06, I reckon.....
Update 14-Sep-05
On the other hand if we look at gold charted in Euros, there is firm
breakout and a steady heading towards range Eu390 to 430 via normal levels
of volatility - at todays closing exchange rate of 1.24ish EUR/USD that is =
$484 to $533
|
|
|
|
| |
|
|