While we're waiting for confirmation signals outlined above, the
charts at this
page deserve attention as a good example of how calmer and 'noise'
free, the charts can be when you take the longer view - without
forgetting that the long term chart can hide some vicious volatility and
related draw-down - draw-down is something that you have to plan for in
order to survive let alone profit - draw down and resource management,
especially when you're working with limited reserves, is another topic
for a future paper.
Meantime, while waiting for the charts to indicate that according to our
adopted timing method, the time has
come to take a long position in gold miners stocks - in illustration of the point that tradable global gold
markets exist both in the metal and in miners' stocks (and a range of
alternative instruments including miners'
indices like XAU &
HUI, and what are called 'futures' &
'options', use of which will be covered at
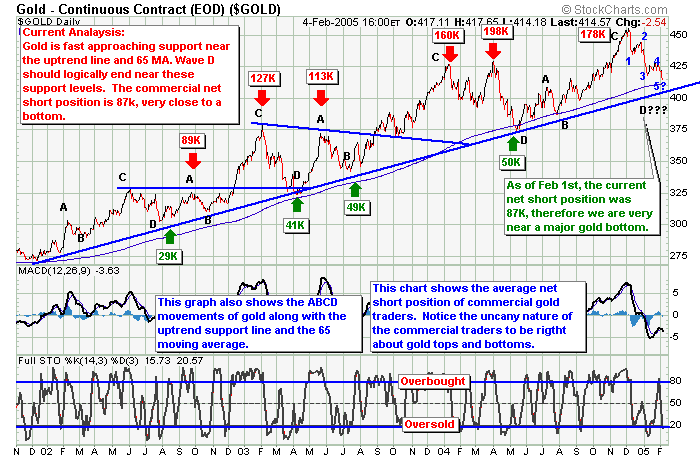
a later date) - with the metal currently pulled back to 430 ish resistance (support)
level, we took an additional (to that taken at 414 near 'rebound' from major gold 'bottom' illustrated above)
position at 429 today 02-03-05.
So to date we've touched superficially upon two additional entry
timing strategies, additional to the adopted one (MA+ADX+DI) that is
being pursued as an action research cycle in relation to a miners stock
index (XAU), and in addition to the simple method chosen (rebound from
the lower line of an upward trend channel, corroborated by continuing
USD weakness) for the metal.
Update 14-03-05 : The
TT club re-entered PAAS
as leap,
call
option contracts today after covering a
short position for the
duration of a small within-trend pull-back, that aggressive trader also
covered some equally short-term short
sold
XAU
call option contracts at the
same time (phew! and today 16th sold PAAS as option contract VZZAD, a 2007
leap,
call
option
contract bought 14th at 3.1, at 3.4 - hey! that's seat of the pants
stuff, it is *not* trend trading - hang on, it gets better today the
16th, whoever was buying VZZAD earlier has dropped out and as one would
expect, market makers are pulling underlying PAAS down for the contracts
expiry date on Friday of this week, so the TT club have placed an order
to buy back again at 3.1 - nice trading if you can get it, up, down, up,
down, in again and up again when the Market Makers pull PAAS down for contracts
expiry date the 19th, all done profitably in the same instrument in one
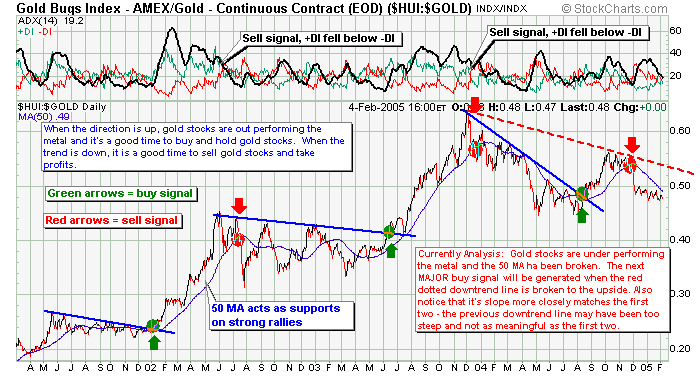
week) but we inveterate trend traders and fledglings, in
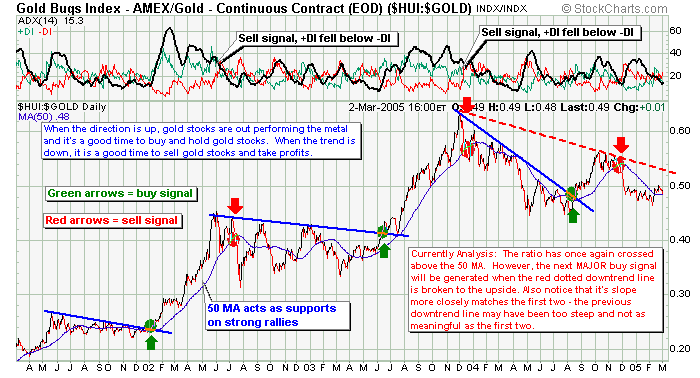
teaching/learning mode, are still watching that metal to miners ratio
for an entry (to miners' stocks index XAU)
signal. We got a positive cross of -DI and +DI, but ADX continued to
trend southwards and sure
enough
XAU tanked temporarily in the nice kind of pullback that is a
healthy indication that the uptrend is still in place.
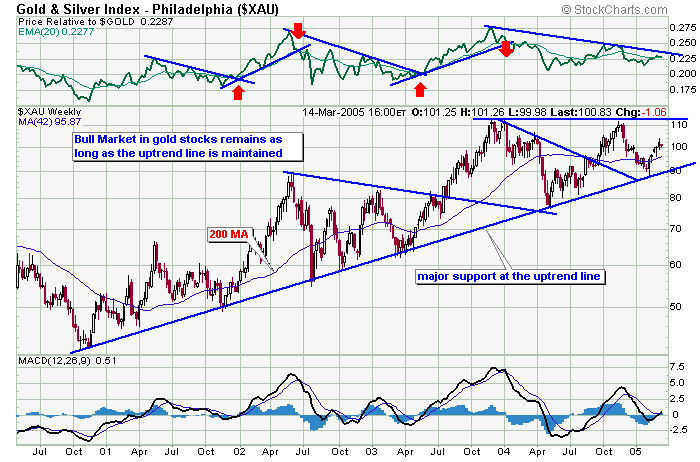
The question in
the air today 15th, is whether XAU, having reached
this
uptrendline, will continue
southwards to
this one... in
that chart,
MACD suggests that it won't but chart of price relative to the metal
shows that it easily could within the long-term uptrend. We shall see,
and wait! A pull-back to lower support level would likely present us
with the perfect entry point signal set. We'll see, and wait - this
module is about conservative trend trading - not daytrade scalping, and
this strand is about timing entry to a miners' stocks index (XAU) not
the metal, though it should be noted that the metal is also at this time
in healthy pull-back mode, as
indeed is individual miner AAUK
(majority owner of AngloGoldAshanti). Update 16th : we can expect miners
to recover after options contracts expire Friday the 18th.
That's our
provisional entry target date and we're not emulating the IT club, entry
will be confirmed by the required signals, or else it won't happen, so
watch this space. You can watch developments from this grandstand
('save' the page to your desktop and open it
there, with java enabled and appropriately configured IE browser - if you normally use Firefox then open
it with IE which you should also have installed for
certain purposes).
Update on option contracts
Expiration Date (the third Friday of the third
month of every quarter) 18th : There aren't any options on AAUK so it's
already been rebounding for the past three days, but 'big' mining stocks like NEM
will be held down by Market Makers today and should take off next week
- that in turn will drive our target instrument, XAU,
but not today.
Update PM : there goes the TT Club's ZZAD order (a PAAS option
contract) - marketpic captured 16.24 CET :
| Pan American Silver Corp (PAAS) |
At
10:24AM ET 180305: 16.680.05 |
|
|
View By Expiration:
Mar 05
| Apr 05
| May 05
| Jul 05
| Oct 05
| Jan 06
| Jan 07
| CALL OPTIONS |
Expire at close Fri, Jan 19, 2007 |
|
You have to admit that the above is a
pretty cool real-time demo by The TT Club,
of your future ability to make money - when fully
developed. Lets keep the
arithmetic simple and call it 20 contracts in the same instrument, VZZAD,
long and short twice in one week (and on the way up again to be sold again
when a worthwhile profit level is reached thanks to within [up]trend volatility) at $35-$45
each contract each leg (of 4 up & down), that's a total of $3k plus a lot more than
operating costs which within the deliberately low cost Kpoly scheme of
things would amount to $40 total in brokerage commissions plus less than
half the same amount to cover all other operating costs (because you the
independent trader are paid by profit only) even if there were no other trades within that week to
share the burden. With a maximum working capital commitment at any time
(if '
margin' is not used) of approx $9k (and a lot less if 'margin' used),
let's call it therefore a minimum net profit of 33% on one instrument in one week -
not bad compared with cocoa farming or a slave labouring in a goldmine in
the land of the $1 a day national minimum wage. If that amount of capital
wasn't available then there would have been, on just 3 contracts using
less than $1k capital, an approaching 30% return after paying expenses,
without using
margin.
Got the message ? |
|
Getting back to 18-03-05 tuition - GLD is rising nicely
now that it's relieved of pressure from MT's , that's a good
indication of a positive week in metals and miners stocks. However, if
markets were that easily predicted you wouldn't need
developmental tuition/training, so wait for the right signals
set for the markets segment we are watching - gold/silverminers index, XAU
Update 21-03-05 : Here we are at the beginning of a new week,
watching gold metal plunge $10 before recovering a little. This is a
nice and timely illustration of the kind of volatility and drawdown you
have to be able to survive as a trader. If we were in the market (like
the TT Club), we *might* have foreseen this outcome of the combined
result of large Asian currency players being out of the markets (and the
knock-on $ effect on metal), and have foreseen the beginning of extended
Easter vacation when many traders and money managers are out of the
market because starting their Easter break - or we might not. In either
event we would have to have ability to survive this kind of draw-down
built in to our trading strategies. If we were in, and watertight in the
face of draw-down, then we should take a day or two off for a fishing
break until things stabilise. because we aren't yet in (miners' index),
we just watching for optimal (miners' index) entry point signals. We
need not worry about the long metal position we entered at $414 on
rebound from uptrendline and max shorts position, because the uptrend is still intact
- and if we hadn't taken that metal position when we did, then now
is another pretty good entry point.
Update 23-03-05: Post bloodbath see this day lesson and PLAN for the unwary.
We clever clogs don't need such measures because we're still waiting for
entry point - about that matter the chart shown at
this day lesson and PLAN, should, without any more assistance, give
you a good indication of when it's going to
happen, as two alternative entry points (see the wave patterns and judge
which is the best wave to 'surf'), now that 'A' has unexpectedly topped
out early before we got a chance to ride it (it did appear until Friday
last that it was going to carry on to XAU 110
- let that be another lesson in the risk element of markets behaviour,
that makes money management and avoidance of over-trading, vital
ingredients of any trading strategy).
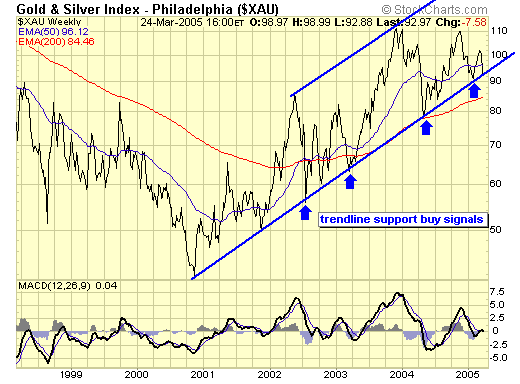 As
you see from the chart for 24-03-05, XAU is on uptrend line at
pre-Easter markets close. (refresh Finance topics)
As
you see from the chart for 24-03-05, XAU is on uptrend line at
pre-Easter markets close. (refresh Finance topics)
The post Easter short week will be interesting! This market is what
is called 'manipulated'.
Manipulation happens for reasons ranging from the political (Greenspan
support for the Bush regime) to ruthless finance oligopolies squeezing unwary
aggressive overtraders out of the market, poorer than at entry. But we,
who are training as
patient trendtraders, are fairly fire proof - that's the strength of what we do.
If
we had plunged in with the metal traders - lets see what would have
happened... serious metal traders are now not watching nervously
for a break of the uptrend line, because aware that there was a
recent 'gap' down in the POG (Price of Gold) and that gaps always get
filled, which means that even if there was a break of the uptrend line,
then recovery to fill that gap would follow, sooner or later... it seems
that *if* our metal traders were worried, then the worry quotient would
be a product of the value of 'sooner or later' - without corroborating support from other signals
(we used ADX and DI
above), then we'd be almost back to where we started having risked capital,
for little gain, and the reward of facing Easter with the possibility of
trendline breakdown... that's acceptable to the aggressive scalper,
but not for us patient intelligent and canny trainee trend traders.
Update 29-03-05: There have been couple of positive signs during the
first two days of the shortened post Easter week, like the short
term Euro & Swiss Franc / US Dollar pairs have turned up
unconvincingly and gold miners ETF,
HUI's
MACD is exhibiting what's called
(often reliable) " bullish
(positive) divergence", but the
fat cat populations of finance oligopolies (your opponents) haven't yet finished their extended Easter hols so volume is
very light and frankly signals under such circumstances simply aren't to
be trusted unless powerfully supported by lots of other sigs too - and
they're not, so we're waiting...
Update 01-04-05: After the bloodbath, see here for an up to date
snapshot of XAU and the metal.
Update 08-04-05
8 weeks from this chart we have the same metal chart
updated to show wave 'A'
in and metal pullback (our probable
XAU entry point as trend traders) nearly
complete. Our metal entry is still OK (though we're keeping the usual
wary eye open for possible $ driven metal trend reversal) and it should
be apparent from the next chart, how we have benefited from waiting for
the right signals combination for
XAU. Aggressive index traders will
have traded the volatility but we're sticking to the pre-planned
strategy and tactics. OK, so there's been no stock index trade, but by
waiting for the correct signals set (which is probably going to give us
leg 'B' to 'C', see metal
entry chart) we've also avoided the recent
XAU
bloodbath when it crashed through the trendline and approached 200 MA
support shown above in the Easter chart.

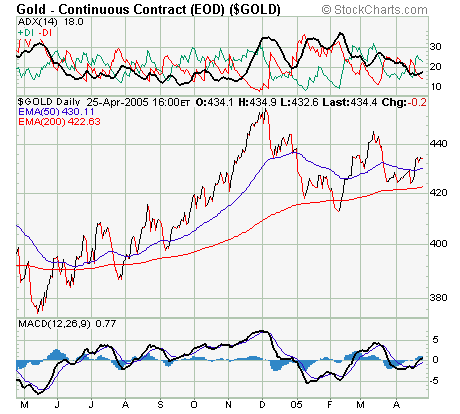
We like like ADX in the following chart
Continued in this space
GOTO Page 2

![[24 hr gold spot]](http://www.kitconet.com/images/live/s_gold.gif)
![[24 hr silver spot]](http://www.kitconet.com/images/live/s_silv.gif)
![[Most Recent Quotes from www.kitco.com]](http://kitconet.com/charts/metals/gold/tny_au_en_bpoz_2.gif)
![[Most Recent Quotes from www.kitco.com]](http://kitconet.com/charts/metals/gold/t24_au_en_bpoz_2.gif)
![[Most Recent Quotes from www.kitco.com]](http://kitconet.com/charts/metals/gold/tny_au_en_bpkg_2.gif)
![[Most Recent Quotes from www.kitco.com]](http://kitconet.com/charts/metals/gold/t24_au_en_bpkg_2.gif)

![[24 hr gold price]](http://kitconet.com/charts/metals/gold/t24_au_xx_usoz_4.gif)
![[Most Recent XAU quotes]](http://kitconet.com/charts/xau/idx24_xau_en_2.gif)
