Copyright (c) B.Achutha 1992 - 2000 Malaysia

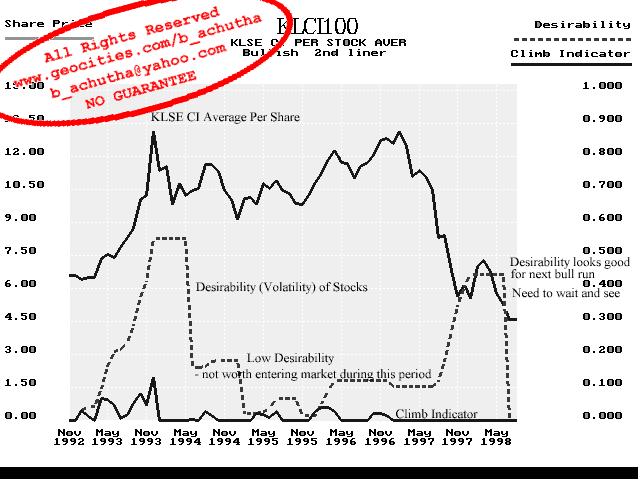
Bull Run of 1998 - Desirability
If you have examined the 1997 Crash graphs you would know that the Desirability function is pretty useful. The graph below indicates the Desirability of the Kuala Lumpur Stock Exchange Composite Index back in 1998. One can observe that the Desirability function is predicting that there is a potential recovery in the market even though the Composite values are crashing. This graph was sent to Datuk Seri Dr. Mahathir prior to the predictions.

|
The 1998 Predictions |
Want to return to map page? MAP