
Copyright (c) B.Achutha 1992 - 2000 Malaysia

Bull Run of 1998 - 3rd Prediction
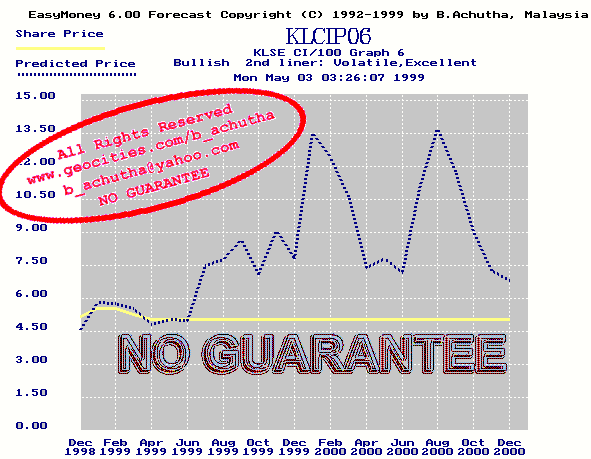
The graph below attempts to predict what would happen if we increased market interest further and added other types of behaviour. Notice that the predicted December 1999 peak has shifted towards January 2000. In actual fact the KLSE CI peaked in mid February 2000. Notice that the original predicted May 2000 rally has shifted towards June 2000. Did I mention that the error in the graphs is +/- one month?
|
The 1998 Predictions |
Want to return to map page? MAP