Copyright (c) B.Achutha 1992 - 2000 Malaysia

Bull Run of 1998 - 2nd Prediction
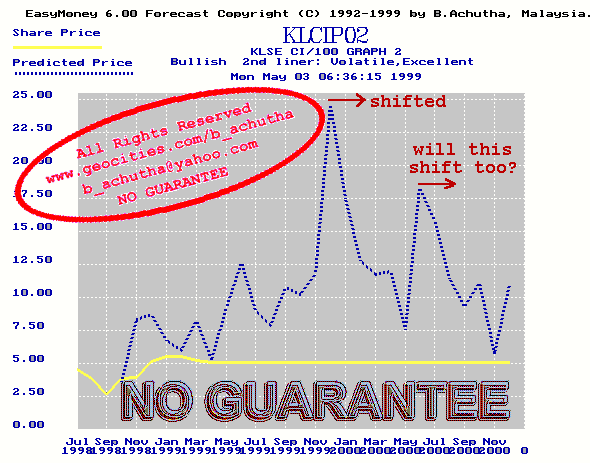
It took me about nine months to modify my predictive models to incorporate a newer technology. By May 1999 I could demonstrate what would happen to the KLSE Composite Index if there is greater market interest. The graph below is not valid for predictions before April 1999 as market interest was not strong enough then. Do observe the predicted October 1999 rally.

|
The 1998 Predictions |
Want to return to map page? MAP