Copyright (c) B.Achutha 1992 - 2000 Malaysia

High vs Low Prices
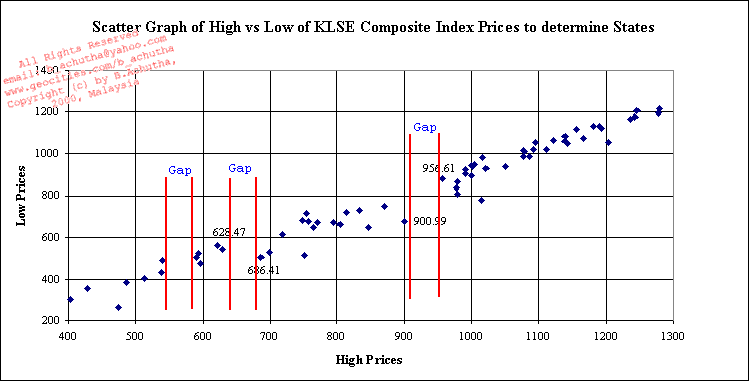
Here we have the KLSE CI scatter graph with high vs low values. Notice any difference?

Want to return to map page? MAP
| |
|||||||||
 |
|||||||||||||||||||||||||||||||||||||
Copyright (c) B.Achutha 1992 - 2000 Malaysia |
|||||||||||||||||||||||||||||||||||||
 |
|||||||||||||||||||||||||||||||||||||
High vs Low Prices |
|||||||||||||||||||||||||||||||||||||
Here we have the KLSE CI scatter graph with high vs low values. Notice any difference? |
|||||||||||||||||||||||||||||||||||||
 |
|||||||||||||||||||||||||||||||||||||
| |||||||||||||||||||||||||||||||||||||