Copyright (c) B.Achutha 1992 - 2000 Malaysia

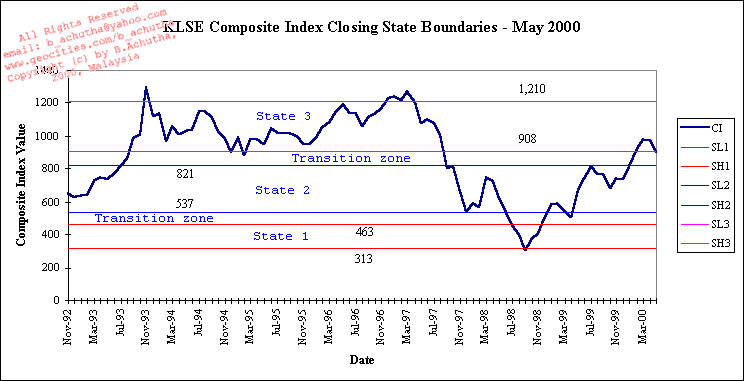
State Boundaries
The state boundaries look like support and resistance levels, don't they? They are not so as the derivation is done differently (for that reason). Do note that since my data is based upon once a month sampling of the stock market (refer to Nyquist / Shannon's Sampling Theorem) the state boundaries I have derived may not be the best values but serve the purpose of this analysis.

Want to return to map page? MAP
| |
|||||||||