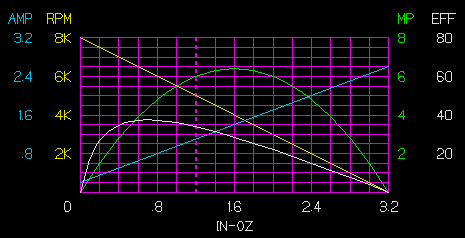
IDEAL DC PER-MAG MOTOR GRAPH
The input data is fictitious and selected for ease of plotting and understanding.
See PHYSICS for a discussion of the terms used.
The four basic parameters; no load RPM and current, and stall torque and current; are roughly similar to a Pittman (Bowser) DC-81.
The current and speed curves are straight,a condition only approached by very expensive, high precision motors. They are usually curved and sometimes drastically. Due to the unknown factors lumped into the K constants, the values read from the graphs can only be rough approximations. Since they provide an overall picture of performance, they are very useful in planning.

Idealized motor graph.
All parameters are plotted as functions of output torque.
No load = 0 -- stall= 3.2 oz-in
NOTE: Ratings and graphs for motors usable in MR, automotive and computers are usually referenced to filtered and regulated 12 VDC for comparison . Imported motors are usually referenced to the metric system using grams (force)-centimeters for torque and watts for power. All other parameters remain the same.
1 oz-in = 72.00773 gm(force)-cm (gmf-cm)= .070618 newton-cm
1 horsepower = 746 watt or 1 mousepower = .001 horsepower = .746 watt
For a metric graph the stall torque will be 230.4 gmf-cm and the maximum power will be 4.77 watt. The MP may be relabeled in watts using the same divisions, while the torque could extend to 250 with 10 gmf-cm divisions.
First no load (0.2) and stall (2.6)current in amperes are marked and a line is drawn between them.
Then no load (8) and stall (0) KRPM are lined similarly.
Note: The mean (average) current (1.4) and RPM (4K) fall on the mean torque line (1.6).
Next the power is computed and plotted at each torque line and connected by a curve, using
(mouse power = .001 horse power):
or 1 MP = 6336 in-oz/min.
Here the force is moving through a distance around a circle.
But r * f = Torque (T).
MP = 2¶ * RPM * T / 6336 = .000992 * RPM * T.
The constant is close to one thousandth, so using RPM in thousands will simplify calculation.
More exact value = 6.34665. Less than 1% error.
Note: maximum (6.4 MP) also falls on the mean torque line.
For metric graphs:
or 1 watt = 611820 gmf-cm/min.
P = 2¶ * RPM * T / 611820 = .000010269 * RPM * T watt.
In the above example the torque is close to 1.6 * 72 = 115.2 gmf-cm. Using .00001 is very close.
Or to eliminate some zeros use RPM in thousands:
Last compute efficiency at the torque lines and plot:
NOTE: All powers must be converted to either watts or mousepower.
Use 1 MP ~= .75 watt = 3/4 watt for quick calculation.
Input power Pi = 12 v * 1.4 A = 16.8 watt = 4/3 * 16.8 = 22.4 MP
Since 4/3 * 12 = 16, a short cut for plotting efficiency in MP is:
Pi = 16 * I A
or Eff = 6.4 MP / 16 / 1.4 A = .2857
More exact value = 28.17 % for a total error of approximately 1.4 %.
What's the difference? Your measurements won't be anywhere near as accurate, especially on an approximation graph..
Examining the graph, the maximum efficiency is at approximately 0.7 torque with a 6.25K RPM and current of .725 A. Output power is 4.375 MP = 3.28 watt. Input power is 8.7 watt. The maximum efficiency is 37.7 %.
Note: It is not near the mean torque line or maximum power, but is at about .21875 (7/32) the stall torque, for .78125 = 78% no load RPM.
For greater accuracy, graphs may be plotted at other voltages of interest following the same procedure. The, often used, shortcut method will yield acceptable approximations.
After all that! QUESTIONS?
WHAT DO YOU DO WITH IT?
The rated continuous current on this motor is 1.1 A. This is on the dotted 1.2 torque line by design to keep the graph and computations simple.
Using the line, speed = 5 KRPM and Power = 6.0 MP
Po = T * KRPM = 1.2 * 5 = 6.0 MP
Efficiency = Po / Pi = 6 MP / (16 * 1.1 A) = 34%.
It must be pointed out that these values are only true at the motor drive gear and not at the track. Friction, in gear train bearings and at tooth faces, reduce force and thus torque, power and efficiency. Obtaining useful, drawbar output power requires measuring speed and the drawbar pull with a dynamometer car.
A good estimate of the total losses can be obtained by running the loco (w/tender) around a loop while carefully measuring the average current. Then by using the above procedure, determine the values needed to just run the loco. This may be done with a typical train also. The differences between the two can yield a good estimate of what is necessary to pull the train.
The motor RPM to current relationship is relatively independent of any losses and may be used to estimate track speeds. The motor RPM to speed ratio must first be determined from an analysis of the gear train.
Except near the low start-up voltage, decent quality motors track well at different voltages, yielding very similar graphs and performance with reduced current, RPM and torque. The comparisons made at 12V will generally hold relatively true at most voltages. Roughly, at a voltage halfway between the start-up voltage and 12V, the three values will be cut approximately in half. For more critical cases, closer graphs can be plotted using the abbreviated current-RPM line method.
Comparison examples by graphic methods, considering turns and flux change, are shown under the SUPER MOTOR heading. Every little bit of knowledge helps your planning.
BACK TO GEAR FUNCTIONS
BACK TO REMOTORING
BACK TO REMOTORING--TESTING
BACK TO REMOTORING--SELECTION
BACK TO SUPER MOTOR
