|
Spotting The Trend & Timing Entry/Exit Points - page 2
We began here with this 04-02-2005 'snapshot' of the global market in gold metal.
Note that the (long blue)
uptrendline was a straight line drawn upward and to
the right below the reaction lows. The longer the uptrendline had been in
effect and the more times it has been tested, the more significant it had become.
We were aware that violation of the trendline usually signals that the trend may be changing
direction.
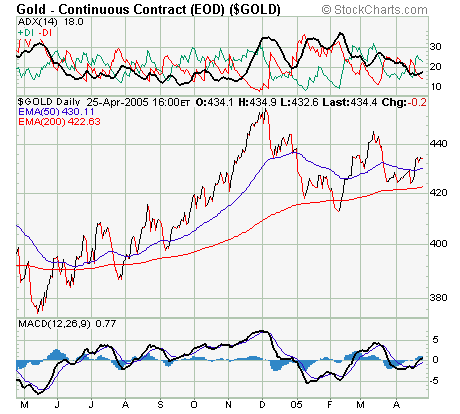
10 weeks later, after a bloodbath, we now like like the ADX and DI
signals of this
chart and the MAs are OK with MACD not too bad either, so we're taking another long position in metal to add to that we
entered at $414 in early Feb - the clever clogs will have aggressively
traded the intervening volatility, but not us conservative canny trainee
trend traders.
Where's XAU? Answer is nowhere
worth doing anything about. The miners are
still getting hammered by a $ driven manipulated market.

Update
8AM GMT 27-04-05 : Some clever clogs aggressives will have
bought into XAU yesterday 26th. Not us canny lot. Why? NEM is going to
open today well down because of an after (American) hours report. As
the biggest miner it will drag the index down. Is the lesson (about
waiting for the correct signals set) sinking in?
Update : Here's the end of same (American) day XAU chart to drive the point
home.
A point worth mentioning is that from here on, miners are in for a very
tough time, or this is or will trigger, the capitulation that mining
stocks need to make a fresh start and get back into a positive trend......

04-05-05
This is not even a tradable bounce to conservative trend traders - look at
XAU's
ADX and DI signals set - you should by now be able to read it as one
significant indicator of traders' behaviour.
Lacking the sophisticated tools and other vast resources and connections
of the finance houses, what does a canny trend trader do? S/he effectively
trades the behaviour of those who have them! Why? Because herd behaviour
is a self fulfilling prophecy, some would say it *is* the markets and that
market manipulators are effective/expert herders
Experience/training develops 'nose' (your reading of a signals set
including ADX) for differentiating herd behaviour from direct market
manipulation.

18-05-05: Metal is still going nowhere (though we didn't have to close positions
opened at 414 in Feb)

18-05-05 : Neither is XAU - you should be able by now to that from XAU alone -
though aggressives have done nicely shorting it.

18-05-05: Therefore since this is about trend trading , instead of
waiting for gold metal and/or miners to resume uptrend, or for a trend
reversal downwards, we'll
re-focus on ETF QQQQ.
We'll watch it for day or so to develop 'nose'
about whether it is about to pullback to back-test the 200 EMA (when/where there could be an optimal
entry point).

24-05-05 : that gap up is not something to chase until ADX shows the
conditions we want.

QQQQ is equally dicey - ADX is confirming
what 'nose' is telling us, that the Qs could easily either continue advancing,
or pull back (and there will be a pullback sooner rather than later) towards
a better entry point near 50 or 200 EMA support. Therefore we're not going
to go long. What we could do (in either or both XAU and QQQQ - and it's about time that the topic/strategy was
introduced) is go long *and* short with Leap 'covered call' Options
(explanation when time permits).
In further explanation, the Qs ADX and other signals are very good
indeed - too good for entry in 'naked' (unhedged) long form. Had we been
focussed on the Qs earlier, we'ld have entered long (naked, or
unhedged) at the point in this chart when after +DI had crossed -DI
northwards or positively, DAX turn up indicating a strengthening positive
mini trend. But since we missed that entry point, we are *not* going to
chase after it. We will instead plan a more canny strategy.
6/06/2005 HUI ( a miners index) price has finally found
the weekly 200ema support. We've been waiting for something like this
since beforfe hen2005 bloodbath, in fact since a major correction began in
late 2003. In the next few days, aggressive traders will get set ups to
buy individual gold stocks, risking 2 to 3% for a possible return of
100%+. This is not a typo, it happened in 2002 and 2003.
12-06-05 : metal has broken above the $422 level after holding above
our $114 entry level. This is a serious upside breakout. It rose to $427
and then pulled back to $423 to retest the solidity of the breakout.
Friday's surge to $427 then triggered a significant upside move, probably
to $485 o above by the end of 2005.
As gold was breaking above $422, silver price confirmed the upside by
also breaking out of a triangular pattern which held the price in check
for the past year. Platinum price is another indicator. A move above the
major resistance at $880 will trigger a move to $1000. The precious metal
markets generally are brewing up.
There are indications of a serious bear market in equities. Perhaps
this is what the precious metals are anticipating.
140605 : gold Commercial Net Shorts has increased to 67k this week,
confirming the major bottom in metal. CNS should continue to rise as
speculaters return to the market, meaning higher bullion prices.

16-06-06 : XAU chart corroborates (refer to earlier coverage of ADX) -
and metal ETF GLD is about to do the same. For shorter term traders whose
'windows' to the markets are 60 min charts and less, its already there, but not for
us canny trend traders.

Why? Because we leave the technical complexities of
trading (manipulated) markets to the finance houses and their friends in
crony capitalist government circles - and we trade their (herd) behaviour.
Where are we at 21-06-05? We have the long position entered at 414 a
lesser one at 422 and a third also at 422 as +DI crossed -DI northwards
(lesser because of a weak ADX). Now despite the worry that gaps do get
filled eventually, there is a fourth entered when metal pulled back to 434
today, with ADX well north of a descending -DI and still howing a rising
mini trend.

A weather eye will be kept on ADX/-DI/+DI if the gap narrows much more and
ADX downturns, we'll smartly get out of the last position and
re-enter at a better price. Why? The answer's the same, it's because the
canny trend trader trades sheeple behaviour (without forgetting that the
flock can be suddenly startled and become completely unpredictable for a
while).

The gold and silver miners index XAU looks less robust with a
weakening ADX and a closing +/-DIs gap. Canny trend traders want to see
indication that the crowd has made up its collective mind about whether to
drive pullback to 50 EMA, or further advance. 50 EMA, or a northward
crossing thereof with ADX black line positively crossing the red -DI line, would be a sound
entry point.
26-06-05 : To read the independent market prognosis of a respected canny trend trader click HERE
- it's evident that there will be a pullback (nothing goes either up or
down in a straight line and the recent rise in metal price left a gap that
will eventually be filled), but the timing and extent are in dispute.

05-07-05 : The ADX/+DI/-DI graph for metal says it all
and you should by now be able to interpret the story without assistance.
Will our basic 414 entry position be threatened as the others were?

Meantime in a nice illustration of the fact that a miner's stock price
doesn't always reflect metal price movements only, the XAU miners' index
looks less weak although ADX is weakening indicating a weakening mini
trend.

The metal seems to be getting good support at the 200 EMA
line and the -DI plus negative trending ADX combo is weakening.
We canny and patient trend traders hold and wait for positive
indicating crowd behaviour in relation to the narrow segment of the
market (metal and miners) on which we are focussed in order to keep this
tutorial manageable. Polytechnic bandwidth, that has made the larger
pics with which this module kicked off too 'fat', is being borne in mind
and may dictate a complete rewrite, but meantime can be worked around by
saving the first page (and this one too if necessary) very early AM
and/or Saturdays - and viewing it offline.

By 12-07-05 the miners index XAU a nice ADX / +DI / -DI signals set
telling us that there is the kind of crowd behaviour that we trade. To
complete the perfect entry point picture we would like to see EMA50
cross EMA200 positively, BUT there is consolation in the fact that

EMA23 has crossed EMA50 in positive direction. So what do we do? We
don't have our perfect setup with a full positive signal set (EMA would
be less significant if we had a definite thrust of ADX northwards across
a falling -DI, indicating a stampede by the herd). Work it out - you
should by now be able to make some decisions unaided.

Has the lesson been driven home? Consider why you were not advised to
take the plunge into the miners index, on the basis of the above mixed
signals. We now wait for a bounce from EMA50, plus a definite positive
reversal of +DI/-DI, plus firmly positive ADX - it could go either way
from this point - a positive 50EMA cross of 200EMA would confirm the
picture of herd behaviour. 15-07-05

Metal is a puzzler. There's a hunch (no more) based on experience, that
it has bottomed but signals set confirmation is awaited - and , 'bottom'
could only be in a short-term sense (possibly presenting the opportunity
of a tradable bounce/mini-rally/mini-trend). Meantime, at least our
solid 414 entry point (position taken the second last time, as can be
seen from this chart, that GLD dipped below 200EMA) isn't threatened
yet.


The above snapshot charts for 11th and 15th Aug 2005 are easily read
against background of our metal entry at $414 - however, what passes for
broadband at the polytechnic has degraded to such an extent that this
material lo longer loads at kpoly terminals during working hours.
to be contd.............
Update 19-08-05 : This action research cycle is slowly grinding to a halt in the
face of 'education' establishment hostility (rooted in and perpetuated by the
fact that nobody is getting 'dashed' to facilitate free 21st century net
mediated education), and related gradual degradation of what was a mickey mouse
'broadband' service to begin with.
At this time, a project manager or student at Kpoly, can for
example only occasionally access a Yahoo mailbox, almost never
access Google Groups, very seldom access his/her (Yahoo)
Geocities personal web site to maintain/develop it, use of
VideoSkype has become completely impossible even at weekends,
and the graphics that are an essential component of
http://kumasipolytechnic.net/kpolytrendtrade2.htm for
example will not load, etcetera.
Update 09-12-05 : Following some months of 'improvements' to and
'upgrading' of the campus internet interface, the situation is
completely unchanged and the cost of decent bandwidth is still being
'invested' in rusty Mercedes, extra wives et cetera, and the foreign
bank accounts of those who have them among beneficiaries of 'aid'.
Our teaching programme, if facilitated, would by now have
reached the following trend trading stage :

09-12-05 :
PAAS is an excellent example of why
you should use "LEAP" Option contracts instead of the shorter term
variety. Look up in page one, the entry point and LEAP contract (VZZAD)
that was selected.
There followed something of a temporary bloodbath, followed in turn
by a strong recovery, so that at this time the position can be exited at
a substantial profit, whereas a shorter term contract would
have been a total loss if held for long enough.
Btw, if you want the advcie, now is the time to take a breather and
some profit, so that you can re-enter at a significantly lower price
and/or later contract expiry date.
 As can be seen from the charts, the values of gold metal, $GOLD, and
precious metals miners shares, have surged. So much so that if we were
still in real-time teaching mode, you would be strongly advised to
reduce your holdings immediately, to zero in metal, and perhaps 25% in
the miners shares index $XAU. It is to be hoped that you are by now
experienced enough to see why. Nothing goes up forever and there will be
a pullback towards if not all the way down to, the 200 EMA line. Exiting
now will enable the 'banking' of profit and re-entry at a considerably
lower level. Those who are stimulated by living dangerously will stay
'in', while watching the indicators like hawks, and hopefully not
get singed. Remember! We canny trend traders are effectively traders in
herd behaviour. However, it's sometimes possible to anticipate/predict
what the herd is going to do before it happens. Good luck! Pity the net
connectivity is so lousy.
As can be seen from the charts, the values of gold metal, $GOLD, and
precious metals miners shares, have surged. So much so that if we were
still in real-time teaching mode, you would be strongly advised to
reduce your holdings immediately, to zero in metal, and perhaps 25% in
the miners shares index $XAU. It is to be hoped that you are by now
experienced enough to see why. Nothing goes up forever and there will be
a pullback towards if not all the way down to, the 200 EMA line. Exiting
now will enable the 'banking' of profit and re-entry at a considerably
lower level. Those who are stimulated by living dangerously will stay
'in', while watching the indicators like hawks, and hopefully not
get singed. Remember! We canny trend traders are effectively traders in
herd behaviour. However, it's sometimes possible to anticipate/predict
what the herd is going to do before it happens. Good luck! Pity the net
connectivity is so lousy.

ETF GLD, $GOLD .......
09-12-05
and the miners index
XAU, all behaving similarly......

Until the greedy rush runs out of steam, the herd panics........

..... and there is a mad scramble for the exit, in a nice and timely illustration of why
we trade herd behaviour (see the 09-12-05 advice to get out).
16-12-05 :
We now want to see if GLD will bounce from one of the EMAs (50 and 200),
or one of those gaps around 47.5, for a possible re-entry point with
positively indicating
ADX and DI signals and CMF (Money
Flow).
If it happens, then it will give us a nice tidy action research cycle
'rounding' event, in the face of subversive opposition from 'aid'
dependant neocolonialist forces and in demonstrative proof that if we can do it
(trade through what has been a difficult year, with a comfortable
year end profit margin), free from 'aid', then anybody can.

Our re-entry at GLD's EMA50 has paid nicely, but beware the new gap -
when it is filled and it will happen sooner or later, then GLD may again
retrace back to EMA50 / EMA200 / earlier_gap(s) around 47.5. Maybe we
should again 'cash in' and see what happens over the New Year break, if
only because with so many people out of the market, the numbers
remaining in make trading herd behaviour quite perilous. We'll watch
closely today 29th and if GLD drops below EMA50 on a two day 15
minute interval chart, then
we'll 'bank' the bounce. At any rate, the tradable 'bounce' has nicely rounded off our teaching (by
real-time action research) and your 'learning by doing' (gold_metal/miners_stock
trading), year.
One final thought : use of terms like 'bounce' are determined by
existence of gaps that usually get filled - on the other hand looked at
on a different time-scale, gold is still in a secular uptrend, so
you could just ignore relatively short-term volatility like the above,
as long as either your money management technique is sound enough to survive
significant 'draw-down' from time to time, or you're very light-footed
and consequently in cash during periods of high 'draw-down' risk - the
latter can be done as we illustrated in real-time (above) but you need a
combination of both techniques in case you get one wrong.
Repeat : you may advise your clients to 'buy and hold' the metal and miners'
index for quite some time ahead, *but* only those who can withstand
considerable temporary 'drawdown' - the very steep (and ongoing) rise in
the market value of the metal and miners' index
XAU) at year end is illustrated
here (in Euros,
meaning nothing at all to do with long-term devaluation of the Bush
dollar), *can* be matched by equally ferocious temporary 'drawdown'.
A broad view of the gold market and general market intelligence can be
viewed here.
NB : As soon as the US markets opened, not only did spot gold
and GLD go through the (two day, 15 minute interval) 50EMA, but it went
through the 200EMA also. Let this be a lesson in money management
vis-a-vis the ability of crony capitalism to manipulate relatively small markets and
crash through people's ability to withstand volatility/drawdown.
Needless to say, we're OK because we saw it coming. But this afternoon there
are some who are wiped out and others who are hanging in there by their
fingernails, in the last bastion of red in tooth and claw capitalism. Take note and internalise ! You could say,
taking a broad view,
that a useful lesson is taught by the above as an illustration of the
adage about a fundamental flaw of capitalism that is heightened/exposed at a time
like this when many are out of the market - it tells us that when there
are too
few capitalists, there cannot be a free market, free from
manipulation/domination. From our narrower trading perspective, we are
lacking the massive herd behavioural homogeneousness that we trade - and
as canny and successful trend traders, we ain't going to go all
adventurous all of a sudden and throw away our proven and tested
principles and techniques.
|

![[24 hr gold spot]](http://www.kitconet.com/images/live/s_gold.gif)
![[24 hr silver spot]](http://www.kitconet.com/images/live/s_silv.gif)
![[Most Recent Quotes from www.kitco.com]](http://kitconet.com/charts/metals/gold/tny_au_en_bpoz_2.gif)
![[Most Recent Quotes from www.kitco.com]](http://kitconet.com/charts/metals/gold/t24_au_en_bpoz_2.gif)
![[Most Recent Quotes from www.kitco.com]](http://kitconet.com/charts/metals/gold/tny_au_en_bpkg_2.gif)
![[Most Recent Quotes from www.kitco.com]](http://kitconet.com/charts/metals/gold/t24_au_en_bpkg_2.gif)
![[24 hr gold price]](http://kitconet.com/charts/metals/gold/t24_au_xx_usoz_4.gif)
![[Most Recent XAU quotes]](http://kitconet.com/charts/xau/idx24_xau_en_2.gif)
