Graphs are diagrams that display
data in an organized manner. The x-axis is the horizontal line on
a graph. The y-axis is the vertical line on a graph.
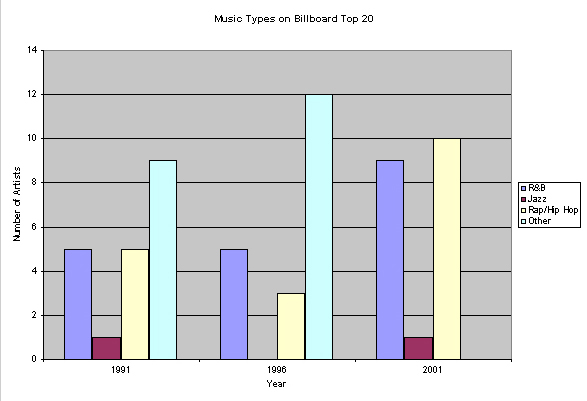 |
Bar Graph = a graph that uses bars
to display data |
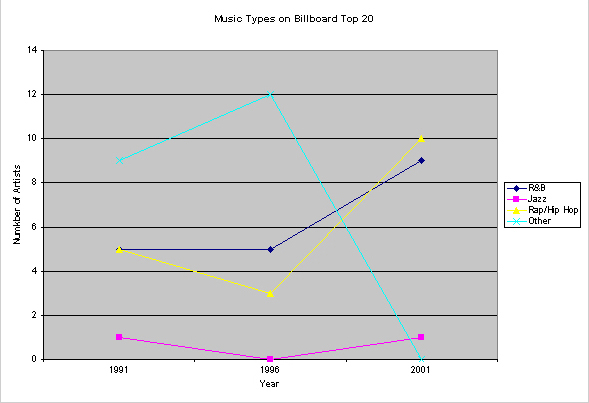 |
Line Graph = a graph that uses a
line to show how data changes over time |
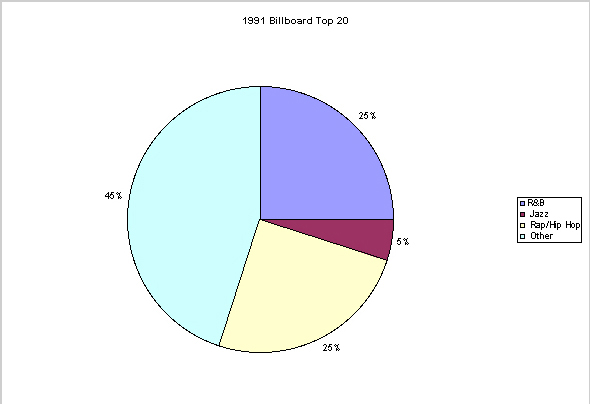 |
Circle Graph = a circular graph
(also called a pie graph) that uses wedges (slices) to show portions of
data |
|
|