Chapter 4 Mixed Model with Censored Data
In this section, we deal with mixed models as given in §2.2 with censored data. The model here is formulated in terms of a single vector for each sample unit (e.g. subject), in stead of one vector consisting of all sample units as in (2.6). For each sample unit, define the mixed model as follows. Suppose that each observation vector y has k components, and there are p fixed effects and q random effects. Then yk×1 for each unit is taken to have model equation
| y = Xβ + Zu + e. | (4.1) |
The p fixed effects on each y are represented by vector βp×1 with its design matrix Xk×p, and the q random effects by vector uq×1 with its design matrix Zk×q.
Meanwhile, as in Chapter 3, we also assume some components of the vector data y were not completely observed. Also, more general than that in §2.2, the variance-covariance matrix of y can be essentially arbitrary.
To facilitate the general incompleteness mechanism, we will use results in Chapter 3. However, in mixed model, each unit y probably has its own distribution due to different design matrices X and Z, so we use the results in §3.3.3 by assigning each unit different density function.
Given  , assume the random effect vector
u follows distribution h2(u|) in some sample space
, assume the random effect vector
u follows distribution h2(u|) in some sample space  . And given u, we have independent observations of vector y from sample space
 with density )).
As in Chapter 3, there are three possible cases for an observed vector y: (a) all components of observations y are completely known, (b) partially observed, some but not all components of y are completely known, (c) all components are censored or totally missing.
We may restate the model (4.1) in terms of each draw as below. For i = 1, 2, ..., n,
| yi = Xi β + Ziu + ei. | (4.2) |
The observed data thus consist of  =(y1+, y2+, ..., yn+), where
yi+ denotes complete part of yi. The complete
data consist of
=(y1+, y2+, ..., yn+), where
yi+ denotes complete part of yi. The complete
data consist of  =(y1, y2, ..., yn, u).
Note that yi*, the incomplete part of yi, is not a part of the observed data. Even yi* might contain certain information as yi* 
 i*, but that
information is reflected in the many-to-one mapping x
i*, but that
information is reflected in the many-to-one mapping x
 y(x) from
 to
as in §2.1
by the fact that (y+) =
{y+}× * as in equation (2.1).
This conditional information is built in as we expand the sampling
space from to .
to
as in §2.1
by the fact that (y+) =
{y+}× * as in equation (2.1).
This conditional information is built in as we expand the sampling
space from to .
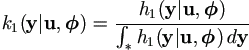
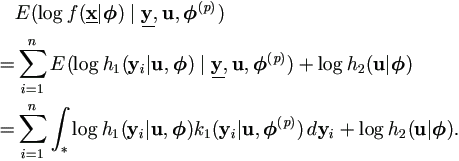
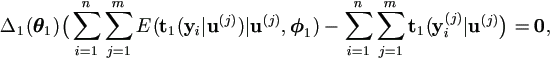
The complete data sampling density from (3.4) is
ƒ(|)= h1(yi|u,)
h2(u|). h1(yi|u,)
h2(u|).
| (4.3) |
Based on Chapter 3, the observed data sampling density given u is
g(|u, )=  h1(yi|u,) dyi. h1(yi|u,) dyi.
| (4.4) |
Then the sampling density for the observed data is
 | (4.5) |
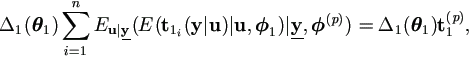
To calculate conditional expectations, we need the following two
notations for the conditional distribution densities. The first is
that of y given y and u, as
 , , | (4.6) |
and the second is for u given and
, denote it by
k2(u|,),
 | (4.7) |
Note that the relationship between these two conditional density functions with the one for complete data given observed data defined in equation (2.3) is as follows,
|
k(|, )=
k1(yi|u, )
k2(u|,).
| (4.8) |
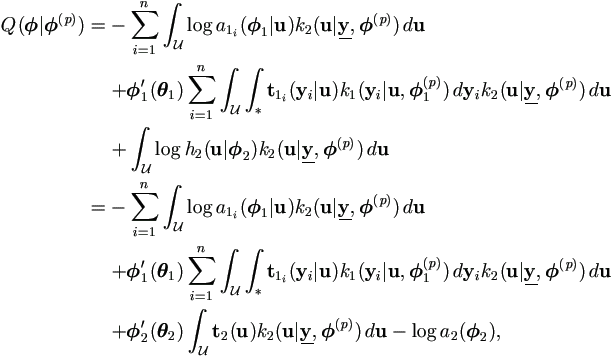
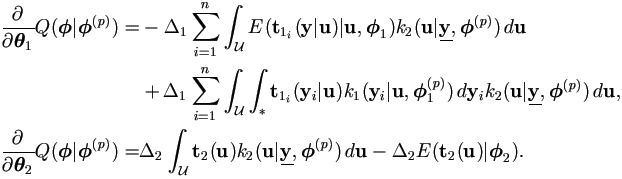
The function Q(|(p)) can be computed as
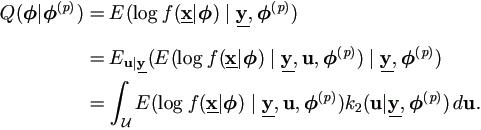 | (4.9) |
Note for given , sampling space
() =
as u's are not observable.
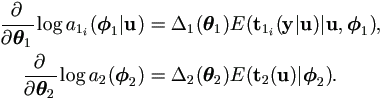
As log ƒ(|)
=  log h1(yi|u,
)
+ log h2(u|),
the expectation over censoring
log h1(yi|u,
)
+ log h2(u|),
the expectation over censoring
From (4.9), we may formulate the general EM algorithm to
maximize the observed likelihood. However, the key component in the function is the sampling density h1(y|u,
4.2.1 Parameter Representations
Suppose that both y|u and u are from the
exponential families as in the form of (2.5) with parameters
In the parameter representation ). Now we illustrate the algorithm with more specific model assumptions.
4.2 Distributions in the Exponential Families
1' and 2' respectively. Now we
have the parameter vector in the form of (2.5) as
= (1',
2')', which is assumed not related to
u. The distribution of y|u does vary with
u's, but we assume the parameter representation in the form
of (2.5) does not depend on u, while let the
other parts t(.), a(.), b(.) vary with u.
of the form
(2.5), its components might be related to each other. For
example, 1 might be a function of covariance of y|u as

Therefore, let θ1 be a parameter vector which
consists of all distinct parameter components from
1 and θ2 from
2. Now the parameter vector of interest is θ = (θ1', θ2')', not a function of u. For simplicity, assume they are not functionally related to each other. Note that the representation in terms of
θ is not unique. For instance, in the example above θ1 could be

Now is in fact a function of θ, it is better to denote the functions by 1(θ1) and
2(θ2) to link these two parameter representations. For notational convenience, we may simply use instead of (θ), also use and θ interchangeably as parameter in many contexts.
Under this parameter representation, by changing the function
(θ), we will have great
flexibility to constrain parameter components, or to specify various
covariance structures. Here we have essentially generalized the
exponential families with respect to the conditional distribution.
Definition 4.1
Assume the Jacobian matrices exist for and
θ. Define
Δ1 =  and
Δ2 =
and
Δ2 =  . .
| (4.10) |
Note that Δ1 = Δ1(θ1) and Δ2 = Δ2(θ2). See Appendix for vector differentiation.
4.2.2 EM Algorithm Implementation
Suppose that the density functions
h1(y|u, 1)
and h2(u|2) are
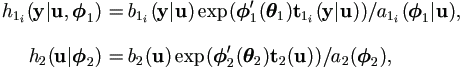 | (4.11) |
| where |
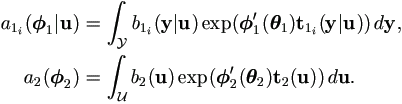 |
| Then |
 |
Since b1i(y|u) and
b2(u) do not involve
(or θ), neither do their
conditional expectations given and
(p),|(p))(p+1) in the M-step . Therefore, the simplified |(p))
 | (4.12) |
Lemma 4.1 Under general regularity,
 | (4.13) |
Proof. Under general regularity, due to the Sundberg's formulae (Sundberg, 1974),
 |
| then |
 |
 | (4.14) |
These are simple transformations of the desired equations.
Theorem 4.1 The EM algorithm for mixed model with incomplete data from regular exponential families can be defined as follows.
| Step 0. | Start with values for parameters
1(0) and
2(0).
Set p = 0.
|
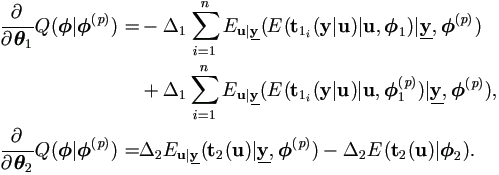
| Step 1. | (E-step) Calculate
|
| Step 2. | (M-step) Determine
(p+1)
by
1(p+1) =
1(θ1(p+1))
as the solution of
2(p+1) =
2(θ2(p+1))
as the solution of
Δ2(θ2)
E(t2(u)|
|
| Step 3. | If converged, set  = (p+1); otherwise increase p by unity and repeat. = (p+1); otherwise increase p by unity and repeat.
|

As in Theorem 3.2, a Monte Carlo EM implementation would be
Theorem 4.2 The MCEM algorithm for mixed model with incomplete data from regular exponential families can be defined as follows.
| Step 0. | Start with values for parameters
1(0) and
2(0).
Set p = 0.
|
| Step 1. | Select simulation sample size m and draw a sample of
as (1), ..., (m) from |,
(p)), for j = 1, ..., m. for j = 1, ..., m.
|
| Step 2. | Determine
(p+1)
by finding
1(p+1) =
1(θ1(p+1)) as the solution of
2(p+1) =
2(θ2(p+1))
as the solution of
|
| Step 3. | If converged, set = (p+1); otherwise return to step 1 with p +1.
|

In the Monte Carlo step 1, if yi is complete, we do not
need to draw any sample as then always 1)=1.1(p))
4.2.3 Asymptotic Dispersion Matrix of MLE
Parallel to the development of Lemma 3.5, we have the following derivatives,


However, under current setting, it is of interest to have asymptotic
dispersion matrix for  in stead of
. By equation (4.11), easy to know
in stead of
. By equation (4.11), easy to know
Theorem 4.3. Assume the dimensions for θ1 and θ2 are r1 and r2 respectively.
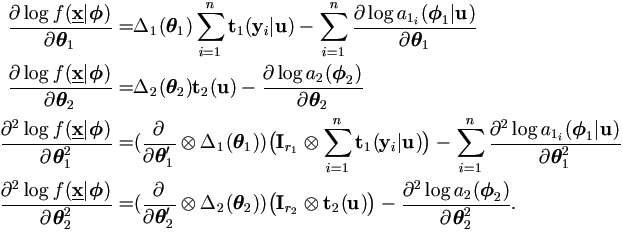
Combine this result with (2.8) to get Fisher information
matrix and estimation for the variance of = (1',1')'.1|u)2),
4.3 Multivariate Normal Distribution
4.3.1 Distribution Parameter Representation
For multivariate normal distribution y ~ Nk(μ, Σ), the density function is

Expressed as in the form of exponential families (4.11), the density function is
h(y|) =
b(y) exp('t(y))/a(),
where the form for each component depends on parameter structures. By the direct computation using equation (A.4), it is easy to verify the representations under the following two common situations.
If both μ and Σ are unknown (see the Appendix for matrix operator vec),

and, if μ is known, but only Σ is unknown,

Note that is a function of θ
as (θ), and parameter vector
θ is formed with all distinct components of
.
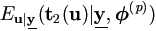
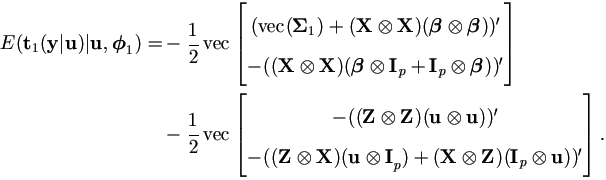
For the mixed model (4.1), assume that e and u are independent and follow multivariate normal distributions e ~ Nk(0, Σ1) and u ~ Nq(0, Σ2), then given u, we have conditional distribution y|u ~ Nk(Xβ + Zu, Σ1). That is,

where parameter
1= 1(θ1) and
θ1 consists of all distinct parameters within
β and Σ1, i.e.
β = β(θ1),
Σ1= Σ1(θ1).
Lemma 4.3. Let μ = Xβ + Zu and Q =(y - Xβ - Zu)' Σ1-1(y - Xβ - Zu), then
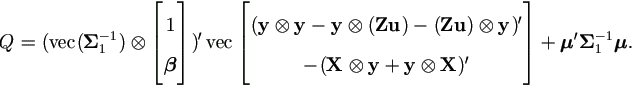
Proof. Since Q is a scalar, Q = vec(Q ) gives
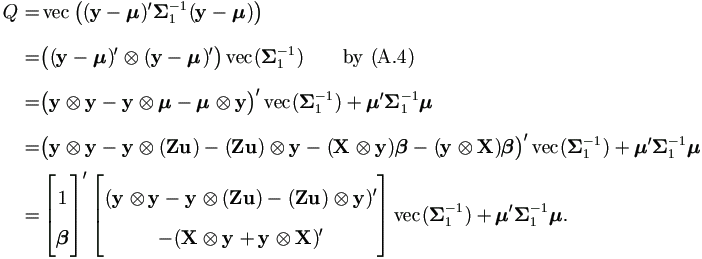
Again, since this is a scalar, using equation (A.4) to get the desired result.
In order to write
1)1(θ1),1|u)1)
Lemma 4.4.
Each
1)
1) =
b1(y|u)
exp(1'(θ1)
t1(y|u)) /
a1(1|u),
where
 |
(4.15) |
| (4.16) | |
| (4.17) | |
For the distribution of u ~ Nq(0, Σ2),
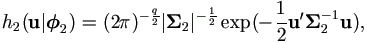
where parameter vector 2=
2(θ2)
and θ2 consists of all distinct
parameters of Σ2, that is
Σ2= Σ2(θ2).
Lemma 4.5.
h2(u|2)
can be written in the form of (4.11) as
2) =
b2(u)
exp(2'(θ2)
t2(u))/a2(2|u),
 | (4.18) |
Calculation of the Jacobian Matrix Δ1(θ1)
 | (4.19) |
By equation (A.23) in the Appendix, it is easy to show that
 | (4.20) |
From (4.15), we have
 .
.
Lemma 4.6.
For
1(θ1)
above, the Jacobian Matrix Δ1(θ1) is
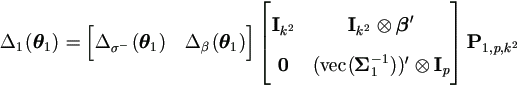 , , | (4.21) |
where the constant matrix P1,p,k² is defined in (A.8).
Proof. By the chain rule (A.15), we have the Jacobian matrix defined at (4.10) as

Then by equation (4.19),
Using the matrix P1,p,k² and by equation (A.12) in the Appendix, we have the result
| . |
|
4.3.2 EM Algorithm Formulation
For notational convenience, now introduce several symbols.
Definition 4.2. Define the following constant matrices,
 | (4.22) |
Definition 4.3. Define the following matrix functions of u,
 | (4.23) |
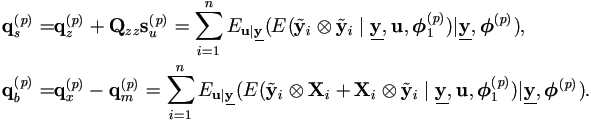
Definition 4.4. Given k2 as in (4.7). Define the following conditional expectations
 | (4.24) |
Definition 4.5. Define the following conditional expectations,
 | (4.25) |
Definition 4.6. Let
 i =
yi - Ziu. Define
i =
yi - Ziu. Define
 | (4.26) |
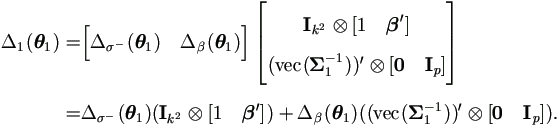
EM Algorithm Formulation: E-step
By Theorem 4.1,  and
and
 need to be calculated in the E-step.
 | (4.27) |
Proof. By (4.16) and (4.23), we have
 | (4.28) |
Then the result is obtained by applying (4.25).
= -  su(p).
| (4.29) |
Since t2(u) = - ½ u  u, the
result holds directly by definition equation (4.24).
u, the
result holds directly by definition equation (4.24).
As shown above, the core calculation involved is the conditional
expectations for yi and
yii*.
 |
(4.30) |
| (4.31) |
EM Algorithm Formulation: M-step
By Theorem 4.1,  and
E(t2(u)|2) need to be calculated.
and
E(t2(u)|2) need to be calculated.
|
E(t2(u)|2)
= - vec(Σ2 ). | (4.32) |
Proof.
Since E(uu'|2) = Σ2,
we have the result
|
E(t2(u)|2)
= - vec (E(uu'|2))
= - vec(Σ2 ). |
|
Lemma 4.10.
Proof. Recall in equation (4.16), we have

Since E(y|u,1)
= Xβ + Zu and
E(yy'|u,1)
= Σ1
+ (Xβ + Zu)(Xβ + Zu)',
then

and recall that X is of order k × p, then
Therefore we have the result,
|
|

Proof. By previous Lemma, and equations (4.22) and (4.25),
 |
|
Lemma 4.12. For any matrices A1×k² and Bp×k²,
Proof. By property (A.10) of matrix P1,p,k² defined at (A.8) in the Appendix,

From equation(4.21), we know that
.
Repeatedly applying (A.4) yields

Since A + β 'B is a row vector and Bvec(Σ1-1) is a (column) vector, we have
|
|
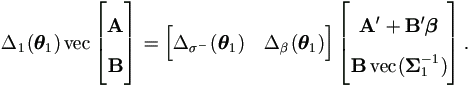
Lemma 4.13.
The M-step seeks the solution of
1
= 1(p+1)
= 1(θ1(p+1)) from
 . . | (4.33) |
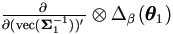
where Δσ - and Δβ are defined as in equation (4.19).
Proof.
By Theorem 4.1, the M-step requires to find
1(p+1) or equivalent
θ1(p+1) as the solution of the following equations,

By Lemma 4.11 and Lemma 4.7, that is equivalent to

Recall that
1 =
1(p+1)
 | (4.34) |
Now apply Lemma 4.12 to both sides of equation
(4.34) above. First note that due to (A.4) and
(A.1),  .
The left hand side of (4.34) is
.
The left hand side of (4.34) is

By equations (A.1) and (A.4), it is easy to verify that
 | and |
That is,  . Therefore the left hand side of (4.34) is
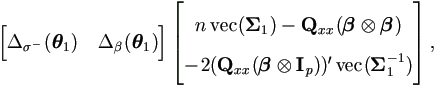
and similarly the right hand side is
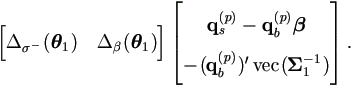
So the M-step seeks the solution of
1 = 1(p+1) from
Note that the second matrix in the bracket above is in fact, by
(A.4) and (A.6), equal to the conditional
expectation of the following matrix given and
1(p),
 | (4.35) |
EM Algorithm Formulation: Procedure
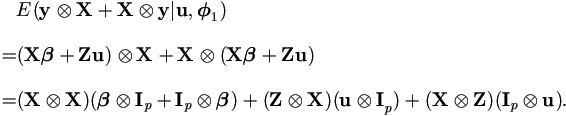
Depending on different parameter representations by specifying various Jacobian matrices Δ1 and Δ2 at (4.10), the following EM-algorithm is applicable to a very broad class of mixed models. In particular, it can handle different covariance structures. These matrices can be calculated as functions of θ (see equation (4.19) for Δ1). Recall,
Based on Lemmas above, we can summarize the EM-algorithm as follows.
| Step 0. | Start with values for parameters
1(0) and
2(0).
Set p = 0.
|
||||
| Step 1. | (E-step) Calculate conditional expectations as given in (4.26) and (4.24),
|
||||
| Step 2. | (M-step) Determine
(p+1)
by
1(p+1) =
1(θ1(p+1))
as the solution of (4.33)
2(p+1) =
2(θ2(p+1))
as the solution of (see equations (4.29) and (4.32))
|
||||
| Step 3. | If converged, set = (p+1); otherwise increase p by 1 and return to step 1.
|

A Monte Carlo implementation of the EM algorithm would differ only in E-step.
Theorem 4.5 Monte Carlo E-step is given as
| (1.1) | Select simulation sample size m and draw a sample of
as (1), (2), ..., (m) from |,
(p)), for j = 1, ..., m.
| ||
| (1.2) | Calculate
|

Plug them into M-step to get (p+1),(p+1),
Again, the drawing mechanism in the Monte Carlo step (1.1) is a
general statement. If yi is complete, we in fact do not
need to draw any sample and let all yi( j)
= yi. Similarly, if yi only has some components
incomplete, we draw only those incomplete components according to
1(p))
4.3.3 Asymptotic Dispersion Matrix of MLE
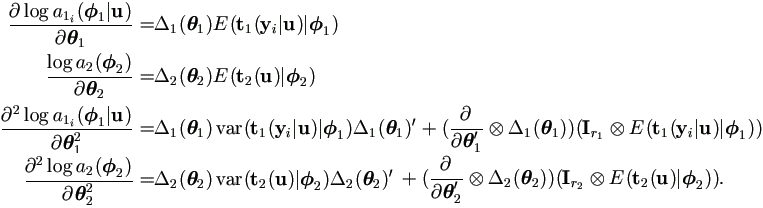
Recall that the following Jacobian matrices are defined previously as

By (4.17),  .
Apply equation (A.27) to
|
.
Apply equation (A.27) to
| | and by equation (4.19),

Denote μ = Xβ + Zu. For the quadratic form

The last step above is due to equation (A.4) and the fact
μX
 | (4.40) |
For the second derivative, first calculate the following two parts using Lemma A.4.
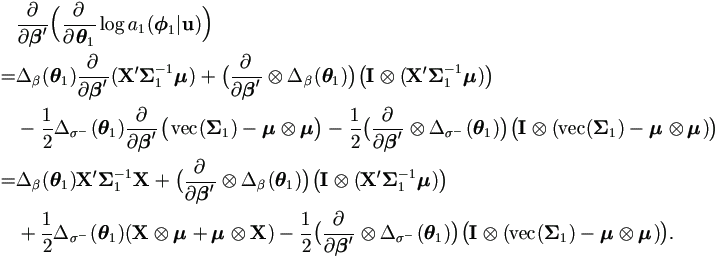

Hence the second derivative is
 | (4.41) |
For h2(u), from Lemma 4.5 we have  .
Apply equation (A.27) to
.
Apply equation (A.27) to  |,
|,
 | (4.42) |
And the second derivative is
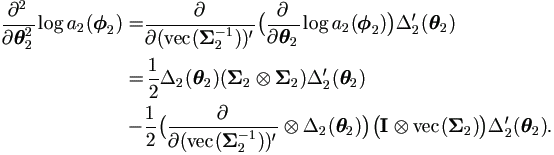 | (4.43) |
Put these derivative calculations into Theorem 4.3 and
then use the result in (2.8) to get Fisher information
matrix and estimation for the variance of
= (1',1')'.
These results are complicated as some non-trivial results are implied
here. Taking θ = will yield the
expected vector and covariance matrix for sufficient statistics
t in any dimension. For example,
E(t2)= -½ vec(Σ2) and
var(t2)= ½ Σ2 Σ2, which gives
var(vec(uu'))= 2Σ2
Σ2 when u ~ Nq(0,Σ2).
On the other hand, each component of θ is usually
from either mean vector or variance matrix, but not both. It implies
that  and
and
 are often 0 .