PowerPoint97 Module 4
Working with Tables, Graphs & Organisation Chart
Launch PowerPoint 97 :
Point
and click <Start>,
<Programs>,
<Microsoft PowerPoint>

Create a Blank Presentation
You can create a blank presentation from scratch (Blank template from the New Slide dialog box selection).
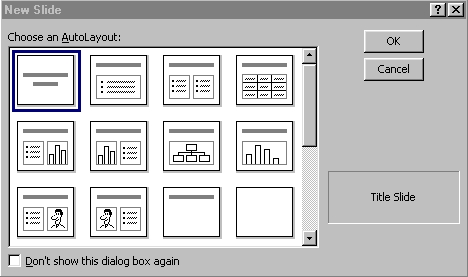
Select <Blank AutoLayout>
Click <File> <Save As>
Type ex2
Click <OK>


Inserting a Table
The quickest way to create a table is to click <Insert Microsoft Word Table>


The other way to create a table is to draw it when you click <Tables And Borders> button

The mouse pointer turns into a pencil, and the Tables And Borders toolbar appears

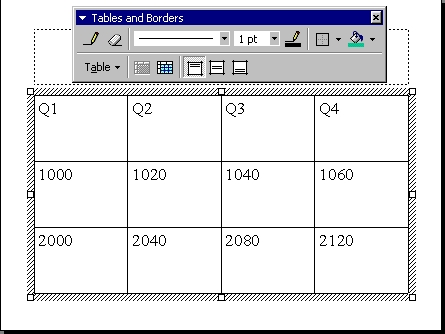
Click <Insert Microsoft Word Table>
Drag the mouse pointer to the cell to three column and three row and release the mouse button

Click <Tables And Borders> button
Draw a box using the pencil
Merging Table Cells
After you've created a table, you might determine that some of table data doesn't fit neatly within the row-and-column format that you've defined. You can use merge cells which is the process of joining multipe cells into one larger cell.
Can you repeat the two more drawings as shown?

Inserting and Formatting a Table
Sometimes, information is best presented in table format. With the Insert Microsoft Word Table feature, you can create and format a table in PowerPoint.
Click <Insert> <New Slide>

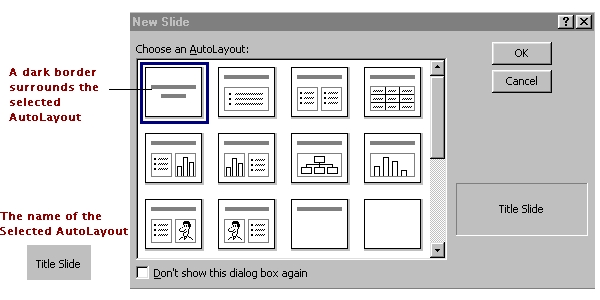
Select <Table AutoLayout>
The Table AutoLayout has been applied

Type Slide title : Impact Success Stories
Double-click the table placeholder
The Insert Table dialog box appears
Click <Table> Click <Insert>
Click <Table>
Select <Number Of Columns:> box with 2
Select <Number Of Rows:> box with 4
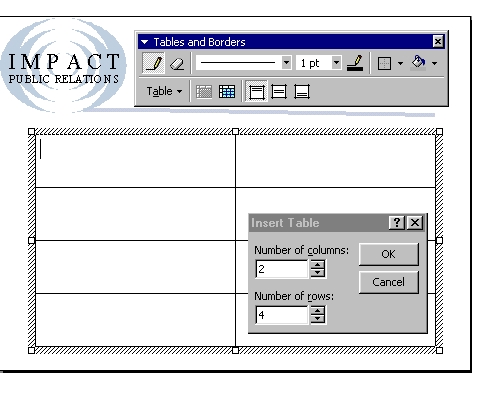
Click <OK>
Type the following
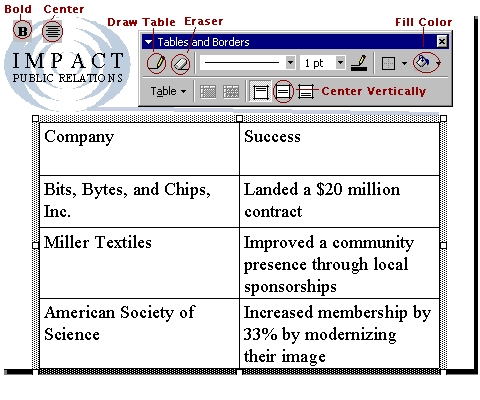
Select <Bold>, <Center>, Center Vertically>, and <Fill Color> buttons
Apply Format on the Company, Success

Click <Draw Table> button
Draw a line under Miller Textiles
Click <Insert> <New Slide>
Select <Table AutoLayout>
Select <Number Of Columns:> box with 4
Select <Number Of Rows:> box with 3
Type the following
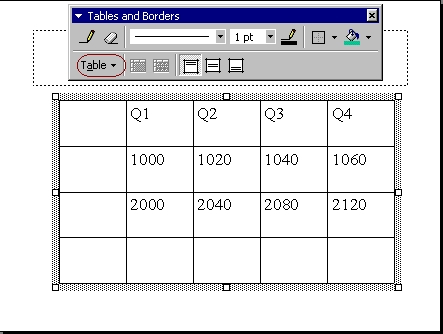
Insert Rows and Columns from <Table> of <Tables And Borders> toolbar
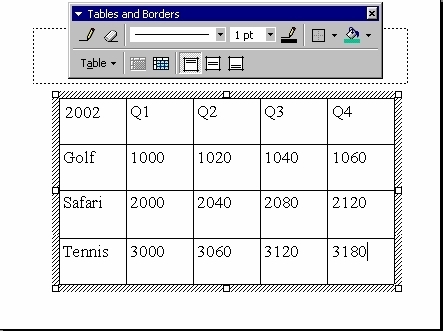
Type the following
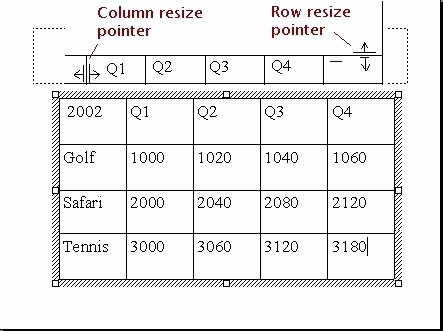
Resizing a Table
PowerPoint lets you resize a table in many ways : column, row and entire table by positioning the mouse pointer over the table.
Adding Shading to a Table
Shading to all or parts of a table emphasizes a portion of the table or to give the appearance of different sections in the table, to help call attention.
Select the first row with the subheading
2002 Q1 Q2 Q3 Q4
Click <Tables And Borders>
The Tables And Borders toolbar appears
Shade the row in Red
Select the remaining rows
Click <Tables And Borders>
The Tables And Borders toolbar appears
Shade the rows in Orange
Inserting and Formatting a Microsoft Graph Chart
Microsoft Graph is a program that PowerPoint uses to insert a chart in a presentation slide (becomes an embedded object in the slide).
You can start Graph by double-clicking a chart placeholder, clicking the Insert Microsoft Excel Worksheet button
on the Standard toolbar, or by clicking Chart on the Insert menu
button
on the Standard toolbar, or by clicking Chart on the Insert menu
 .
.
Click <Insert> <New Slide>
Select <Chart AutoLayout> Slide
Type Slide title : Proven Results
Double-click the chart placeholder
PowerPoint launches Microsoft Graph
Alternatively
Click <Insert Microsoft Excel Worksheet>


Change Data in a Chart
To type in new text or value, delete the entire datasheet
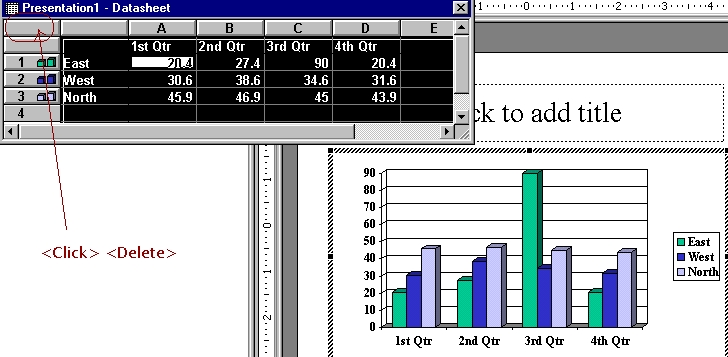
Type the data in the datasheet
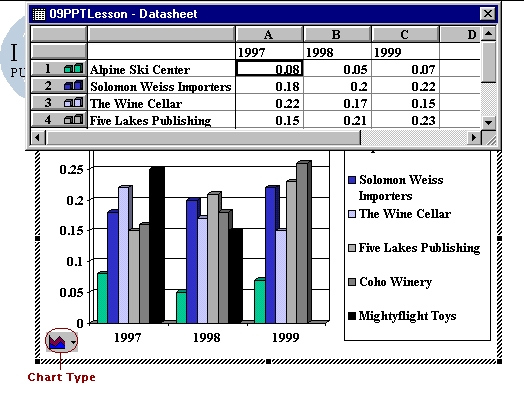
Changing the Chart Type
Click <Chart>
Click <Chart Type>
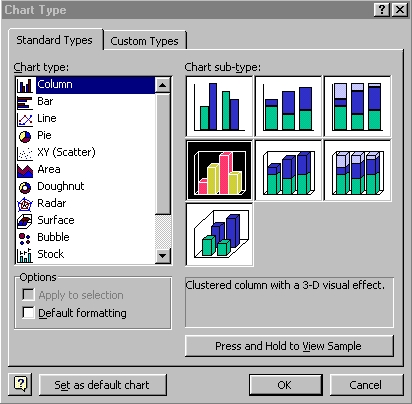
Select <3-D Bar Chart>
Click <OK>
Add Chart Title
Click <Chart>
Click <Chart Options>
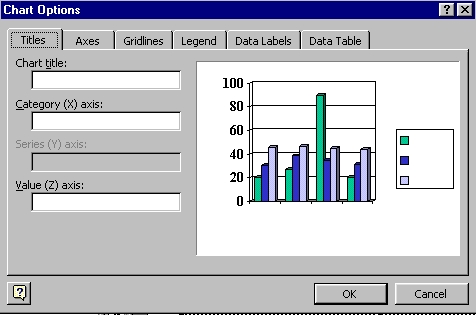
Type Sales Report at <Chart title:> box
Recolor Chart
Double-click any column in the chart
Click <Format>
Click <Selected Data Series>
Click <Patterns> tab
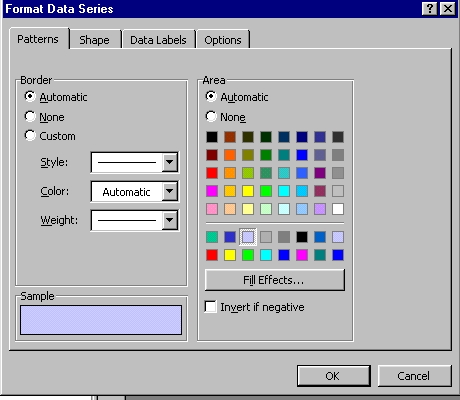
Click <Fill Effects> tab to specify a fill effect
Select the options for Gradient, Texture, Pattern, Picture.
Click <OK>
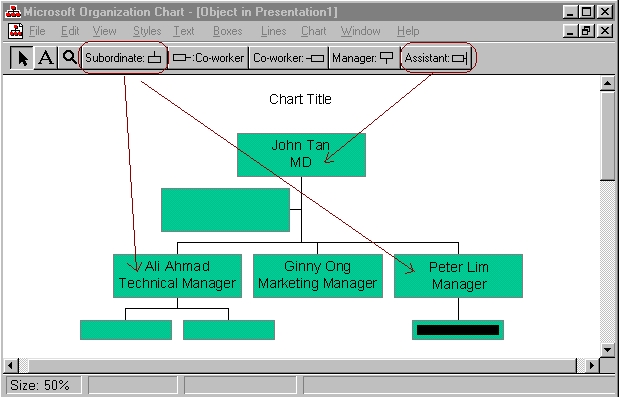
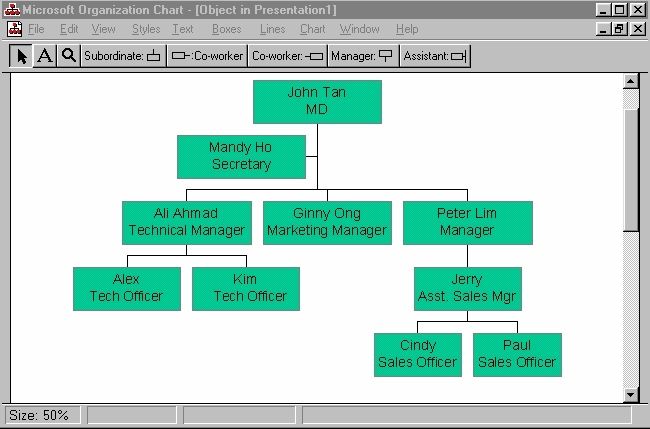
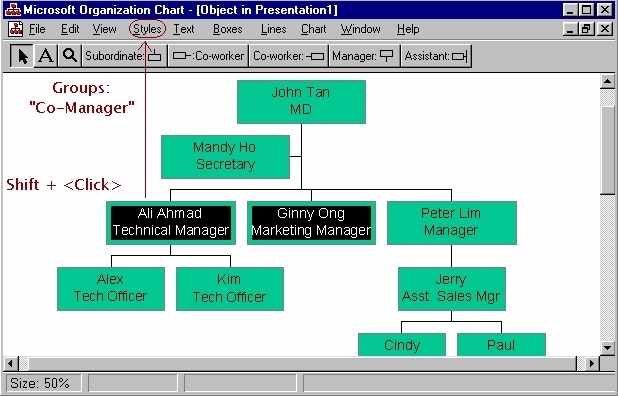
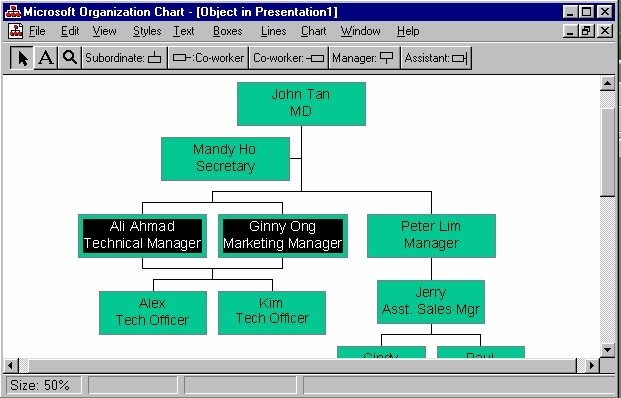
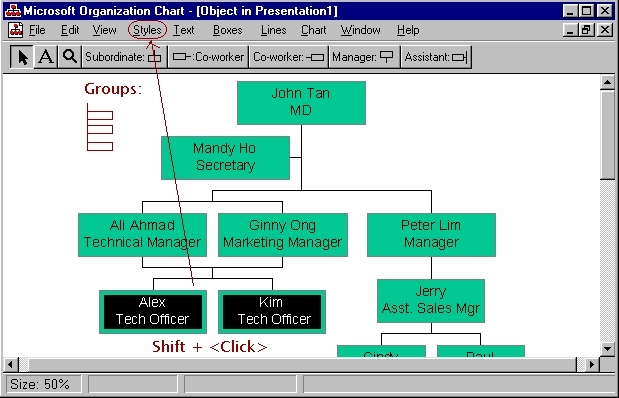
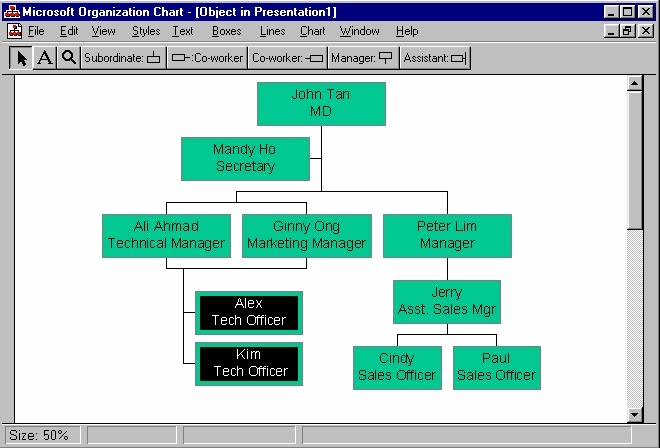
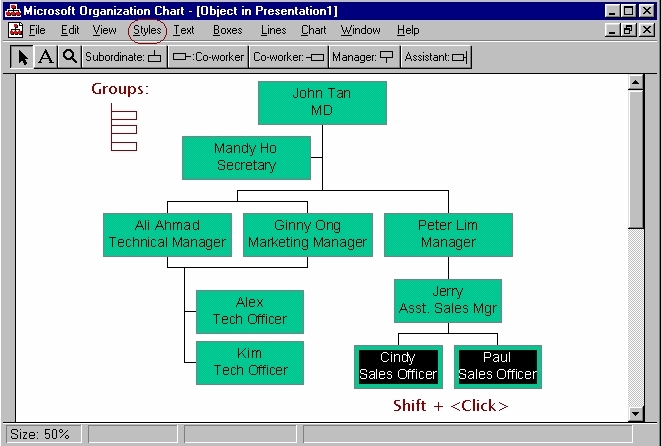
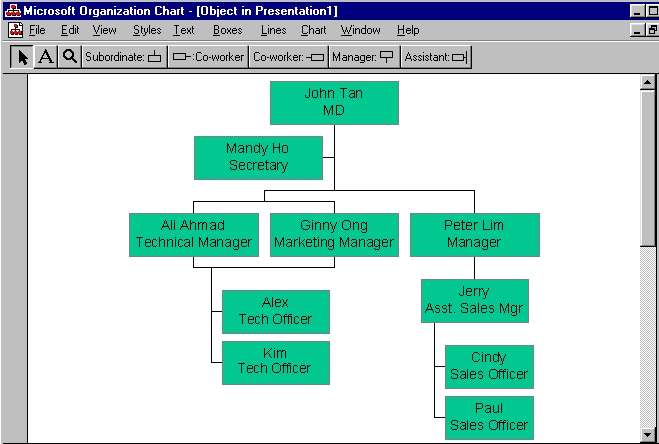
Inserting and Modifying an Organizational Chart
Microsoft Organization Chart ins a program that PowerPoint uses to embed organizational chart objects in presentation slides, which you can edit any time.
Click <Insert> <New Slide>
Select <Organization Chart AutoLayout> Slide
Type Slide title : About Impact PR
Double-click the org chart placeholder
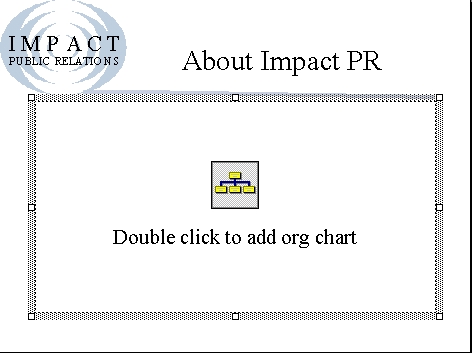
PowerPoint launches Organization Chart
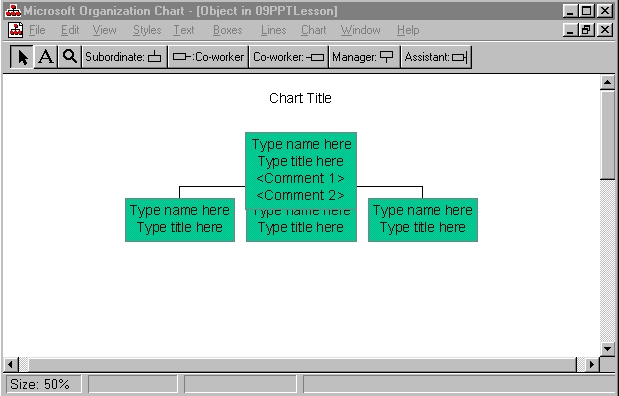
Type John Tan, MD
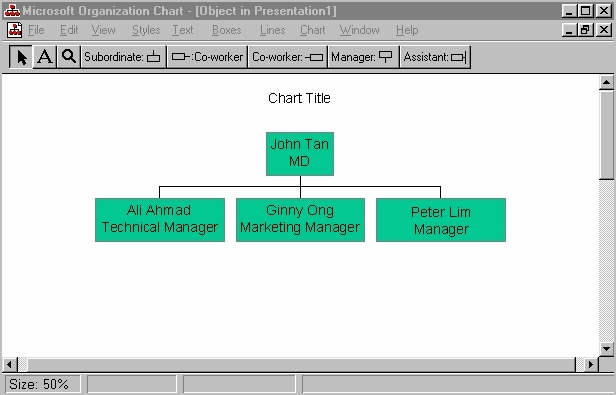
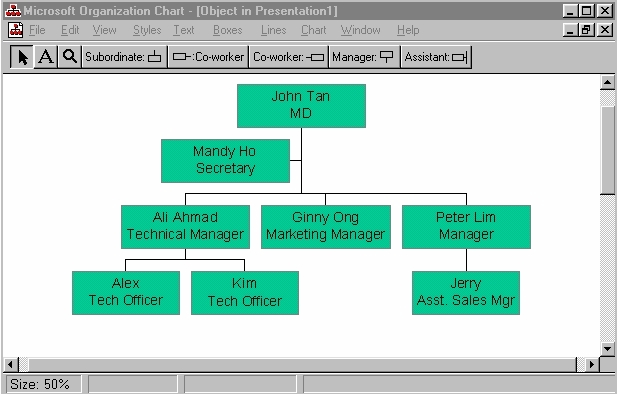
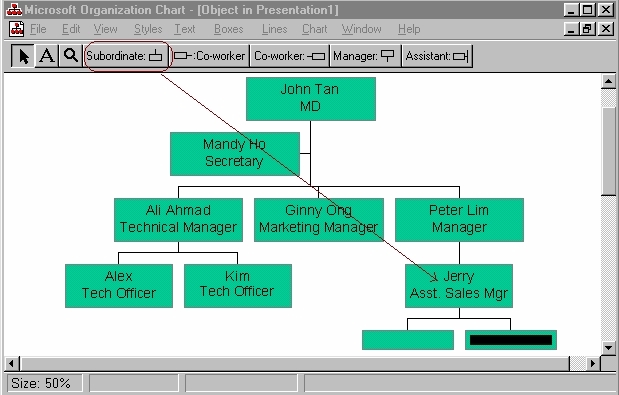
Type the rest of organizational structure
Refer to M4 Page 11-15 for Practice Exercise


 button
on the Standard toolbar, or by clicking Chart on the Insert menu
button
on the Standard toolbar, or by clicking Chart on the Insert menu
 .
.


Practice Exercise
How to create a Table ?

How to create a Chart ?

How
to create an Org. Chart ?


 Edwin
Koh : We
completed on the
Edwin
Koh : We
completed on the
New
Knowledge and Skills in
MS
PowerPoint97 Module 4.