|
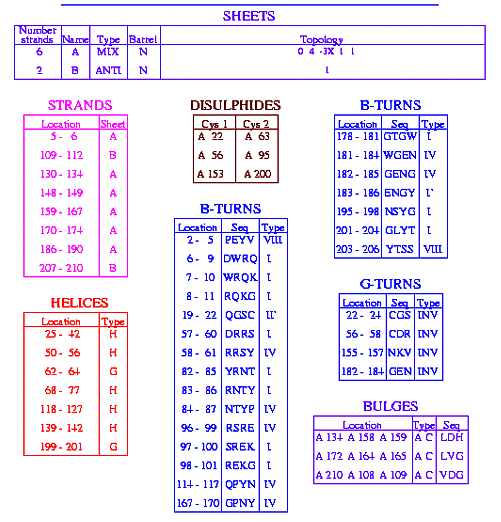
SECONDARY STRUCTURE PREDICTION AND SUMMARY
Secondary Structure refers to the local folding
pattern of the polypeptide chain and are are predominantly
stabilized by hydrogen bonds. The most common type of secondary structures
in proteins,
are the alpha helices, beta sheets, and turns.
That which cannot be classified as one of the standard three
classes is usually grouped into a category called "other"
or "random coil"(1).
With the use of Anthreprot
software the secondary structure of a protein can be predicted. Anthepreot
provided a combination of different methods such as Garnier
(GOR 1),Levin, DPM, Predator etc. The aim of secondary structure
prediction is to provide the location of alpha helices, and beta
strands within a protein or protein family. The GOR(Garnier, Osguthorpe and Robson) method
assumes that amino acids up to 8 residues
on each side influence the secondary structure of central residue(2)
                                NH2	A G T F H N D  S  H I K N M D A		COOH
                                      -8              0            +8
The frequency of amino acids at the
central position in the window, and at -1, .... -8 and +1,....+8 is
determined for a, b and turns (later other or coils) to give three 17 x 20
scoring matrices. The GOR method uses information theory and the values
in these tables to calculate the probabilities that the central residue
is one type of secondary structure not another(2).
Fig 1 below shows the result of the GOR 1 method use to prediction the secondary structure of papain(1cvz)

|
|
Fig. 1
Secondary structure prediction
of papain(pdb 1cvz) using the Garnier(GOR 1) method available in Antheprot.
|
Fig. 2
Fig 1 b
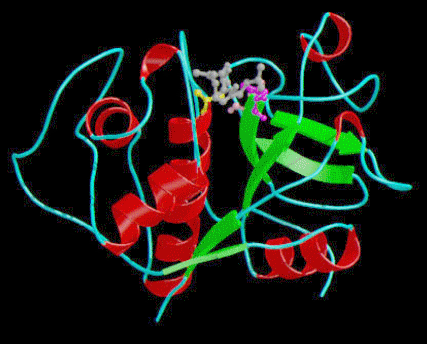
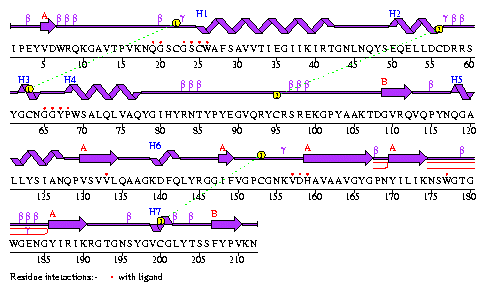
Fig 1 b above shows the sequence of the residues and locations of the
helices(H1-H7).
Figure 2 above
shows a secondary structure of papain (pdb 1cvz) the helices are
colored red while the beta sheets
are colored green.
Fig. 3 BELOW PROVIDES A SUMMARY OF THE SECONDARY
STRCTURES OF PAPAIN(7)
, (8)
|
Pepetide torsion angles
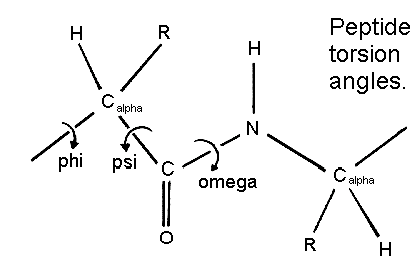
Peptide Torsion Angles(3)
The figure below shows
the three main chain torsion angles of a polypeptide. These are phi , psi
, and omega .
In a polypeptide the main chain N-C alpha and C alpha
-C bonds relatively are free to rotate.. These rotations are represented
by the torsion angles phi and psi , respectively.
|
|
|
|
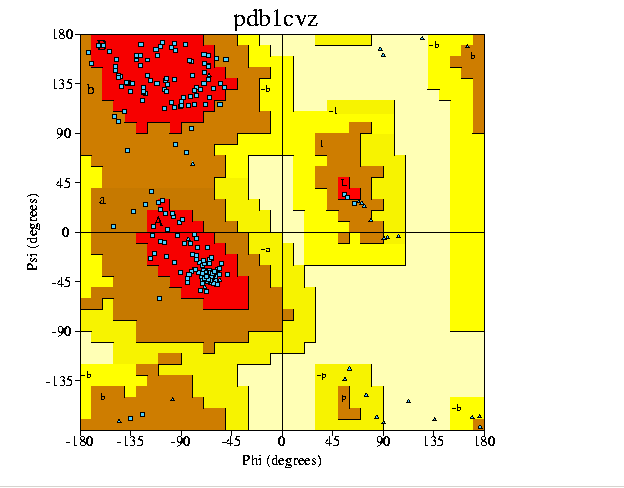
RAMCHANDRAN PLOT
Fig. 4 on the right shows the
Ramchandran plot for Papain(1cvz). GN Ramachandran used computer models
of small polypeptides to systematically vary and with the objective of
finding stable conformations. For each conformation, the structure was
examined for close contacts between atoms. Atoms were treated as hard spheres
with dimensions corresponding to their van der Waals radii. Therefore, an
angles, which cause spheres to collide correspond to sterically disallowed
conformations of the polypeptide backbone(4).
In the diagram on the right,
the light yellow areas correspond to conformations where atoms in the polypeptide
come closer than the sum of their van der Waals radii. These regions are
sterically disallowed for all amino acids except glycine which is unique
in that it lacks a side chain(notice glycine is shown as a small blue triangle).
Disallowed regions generally involve steric hindrance between the side chain
C methylene group and main chain atoms. Glycine has no side chain and therefore
can adopt phi and psi angles in all four quadrants of the Ramachandran plot.
Hence it frequently occurs in turn regions of proteins where any other residue
would be sterically hindered. The red regions are the most favored region
which contains(154 residues).Additional allowed region is shown in brown(18
residues). The generously allowed region is shown in bright yellow.
SUMMARY
No. of
residues %-tage
------ ------
Most favoured
regions [A,B,L]
154 89.5%*
Additional allowed regions
[a,b,l,p]
18
10.5%
Generously allowed regions [~a,~b,~l,~p]
0 0.0%
Disallowed regions
[XX]
0
0.0%
----
------
Non-glycine and non-proline
residues
172
100.0%
End-residues (excl. Gly
and Pro)
2
Glycine residues
28
Proline residues
10
----
Total number of residues
212
|
RAMCHANDRAN
PLOT [PAPAIN (PDB CODE 1CVZ)](12)
Fig.4
|
|
Inside/Outside
RMS Z-score plot
The Inside/Outside distribution normality RMS
Z-score over a 15 residue window is plotted as
function of the residue number. High areas in the plot (above 1.5) indicate
unusual inside/outside
patterns. (13)
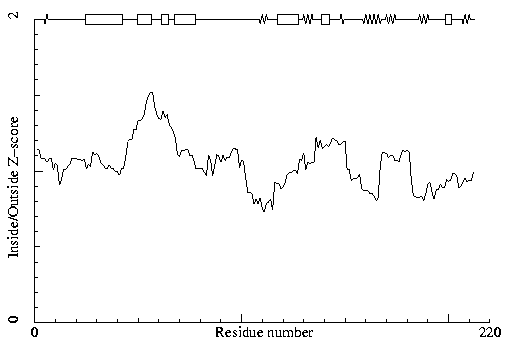
RMS Z-score for papain(1cvz)
|
|