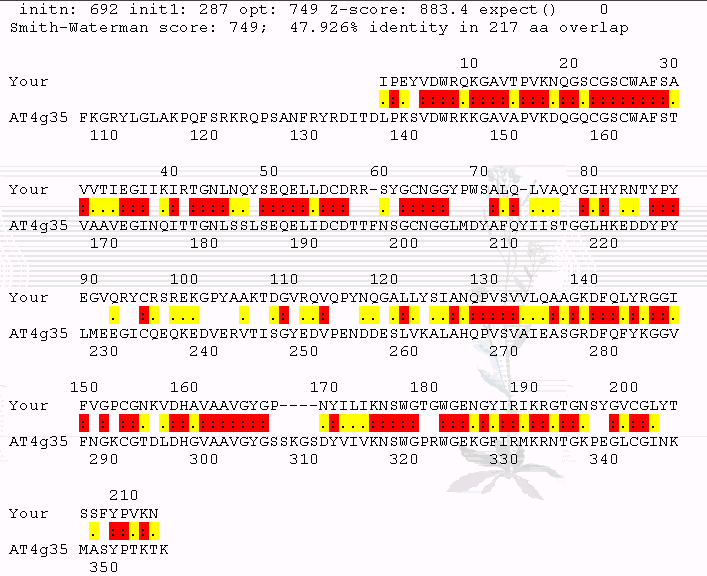
Alignment of Papain(Accession P00784)
against AT4g35350 [Arabidopsis thalia]

The result shows a significant similarity
between papain and cysteine proteinase(A. thaliana) (1)
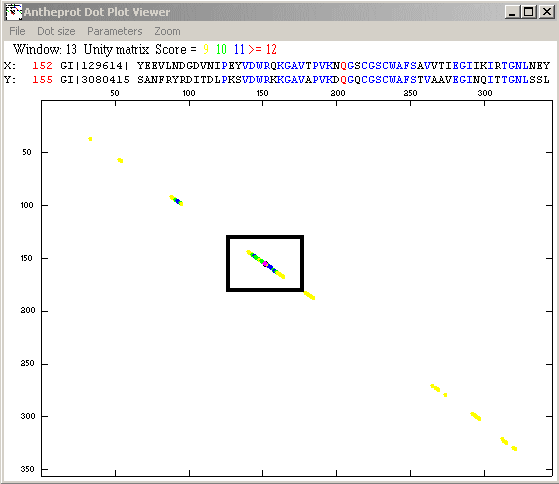
ANTHEPROT DOT PLOT
This is a bidimensional plot in which the sequence
of the protein to be compared is plotted at the X-axis, and the sequence
of the protein we want to compare with is plotted at the Y-axis. Using an
amino acid substitution matrix, it is calculated a degree of similarity between
the two proteins. If the degree of similarity is significant, a dot is plotted
in the diagonal of the graph (3).
|

|
| The dot plot matrix reveal significant similarities between
Papain(pdb 1cvz) and cysteine proteinase obtained from A . thaliana |
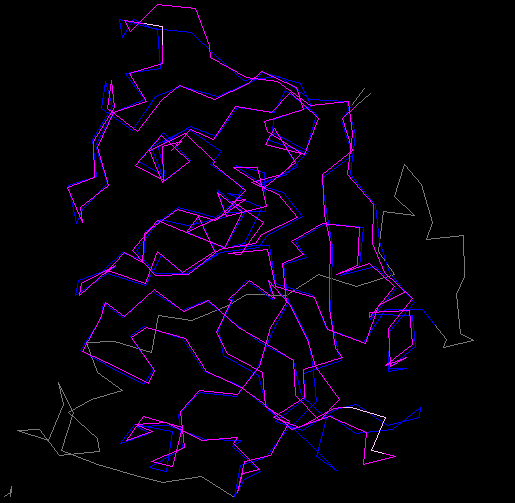
3D ALIGNMENT OF PAPAIN AGAINST A. thaliana
PROTEIN( CAA18734)

|
Fig. 1. 3D homology alignment
of papain(1cvz) chain A, against cysteine proteinase of
A. thaliana. Papain(pdb1cvz) is colored purple,
while blue represents A. thaliana protein(CAA18734) (12)
|
|
![]()

![]()
