|
[11]
Dashboard Design: Key Performance Indicators
& Metrics By Thomas Gonzalez BrightPoint
Consulting
(Please see
Dashboard Design: Key Performance Indicators
& Metrics By Thomas Gonzalez BrightPoint Consulting.
Our Server)
This article will focus on collecting and defining metrics and key
performance indicators for executive and operational dashboards. While
the techniques discussed here can be used across many different business
intelligence requirements gathering efforts, the focus will be
collecting and organizing business data into a format for effective
dashboard design.
With the explosion of dashboard tools and technologies in the
business intelligence market, many people have different understandings
of what a dashboard, metric, and key performance indicator (KPI) consist
of. In an effort to create a common vocabulary for the scope of this
article, we will define a set of terms that will form the basis of our
discussion. While the definitions below might seem onerous and require a
second pass to fully understand them, once you have grasped the concepts
you will have a powerful set of tools for creating dashboards with
effective and meaningful metrics and KPIs.
Metrics and Key Performance Indicators:
Metrics and KPIs are the building blocks of many dashboard
visualizations; as they are the most effective means of alerting users
as to where they are in relationship to their objectives. The
definitions below form the basic building blocks for dashboard
information design and they build upon themselves so it is important
that you fully understand each definition and the concepts discussed
before moving on to the next definition.
-
- Metrics: When we use the term metric we are referring to
a direct numerical measure that represents a piece of
business data in the relationship of one or more dimensions.
An example would be: “gross sales by week.” In this case, the
measure would be dollars (gross sales) and the dimension
would be time (week). For a given measure, you may also want to see
the values across different hierarchies within a dimension. For
instance, seeing gross sales by day, week, or month would show you
the measure dollars (gross sales) by different hierarchies
(day, week, and month) within the time dimension. Making the
association of a measure with a specific hierarchal level within a
dimension refers to the overall grain of the metric.
Looking at a measure across more than one dimension such as gross
sales by territory and time is called multi-dimensional
analysis. Most dashboards will only leverage multi-dimensional
analysis in a limited and static way versus some of the more dynamic
“slice-and-dice” tools that exist in the BI market. This is
important to note, because if in your requirements gathering process
you uncover a significant need for this type of analysis, you may
consider supplementing your dashboards with some type of
multi-dimensional analysis tool.
-
- Key Performance Indicators (KPI): A KPI is simply a
metric that is tied to a target. Most often a KPI represents how far
a metric is above or below a pre-determined target. KPI’s usually
are shown as a ratio of actual to target and are designed to
instantly let a business user know if they are on or off their plan
without the end user having to consciously focus on the metrics
being represented. For instance, we might decide that in order to
hit our quarterly sales target we need to be selling $10,000 of
widgets per week. The metric would be widget sales per week;
the target would be $10,000. If we used a percentage gauge
visualization to represent this KPI and we had sold $8,000 in
widgets by Wednesday, the user would instantly see that they were at
80% of their goal. When selecting targets for your KPI’s you need to
remember that a target will have to exist for every grain you
want to view within a metric. Having a dashboard that displays a KPI
for gross sales by day, week, and month will require that you have
identified targets for each of these associated grains.
Scorecards, Dashboards, and Reports:
The difference between a scorecard, dashboard, and report can be one of
fine distinctions. Each of these tools can combine elements of the
other, but at a high level they all target distinct and separate levels
of the business decision making process.
-
- Scorecards: Starting at the highest, most strategic level
of the business decision making spectrum, we have scorecards.
Scorecards are primarily used to help align operational execution
with business strategy. The goal of a scorecard is to keep the
business focused on a common strategic plan by monitoring real world
execution and mapping the results of that execution back to a
specific strategy. The primary measurement used in a scorecard is
the key performance indicator. These key performance indicators are
often a composite of several metrics or other KPIs that measure the
organizations ability to execute a strategic objective. An example
of a scorecard KPI would be an indicator named “Profitable Sales
Growth” that combines several weighted measures such as: new
customer acquisition, sales volume, and gross profitability into one
final score.
- Dashboards: A dashboard falls one level down in the
business decision making process from a scorecard; as it is less
focused on a strategic objective and more tied to specific
operational goals. An operational goal may directly contribute to
one or more higher level strategic objectives. Within a dashboard,
execution of the operational goal itself becomes the focus, not the
higher level strategy. The purpose of a dashboard is to provide the
user with actionable business information in a format that is both
intuitive and insightful. Dashboards leverage operational data
primarily in the form of metrics and KPIs.
- Reports: Probably the most prevalent BI tool seen in
business today is the traditional report. Reports can be very simple
and static in nature, such as a list of sales transaction for a
given time period, to more sophisticated cross-tab reports with
nested grouping, rolling summaries, and dynamic drill-through or
linking. Reports are best used when the user needs to look at raw
data in an easy to read format. When combined with scorecards and
dashboards, reports offer a tremendous way to allow users to analyze
the specific data underlying their metrics and key performance
indicators.
Gathering KPI and Metric Requirements for a Dashboard:
Traditional BI projects will often use a bottom-up approach in
determining requirements, where the focus is on the domain of data and
the relationships that exist within that data. When collecting metrics
and KPIs for your dashboard project you will want to take a top-down
approach. A topdown approach starts with the business decisions that
need to be made first and then works its way down into the data needed
to support those decisions. In order to take a top down approach you
MUST involve the actual business users who will be utilizing these
dashboards, as these are the only people who can determine the relevancy
of specific business data to their decision making process.
When interviewing business users or stakeholders, the goal is to
uncover the metrics and KPI’s that lead the user to a specific decision
or action. Sometimes users will have a very detailed understanding of
what data is important to them, and sometimes they will only have a high
level set of goals. By following the practices outlined in the article,
you will be able to distill the information provided to you by the user
into a specific set of KPIs and metrics for your dashboards. (Please see
Dashboard Design: Key Performance Indicators
& Metrics By Thomas Gonzalez BrightPoint Consulting.
Our Server)

[12]
Barriers to Performance Improvement
Here's a wish-list that I suspect many of us
share in our work lives:
- If only we could measure an increase in mindshare.
- If only we measured what was really important.
- If only we could look at a customer's complete product portfolio
and service history.
- If only we knew which improvements would have the strongest
effect on revenue growth.
- If only management knew how little time we have to work on
"priorities" because we get bogged down answering emails and
attending meetings.
So many "if only's." It's easy to feel helpless to make headway in your
performance management efforts. Where should you begin? Believe it or
not, although each industry/business model will present unique
challenges, many organizations have the same barriers to performance
improvement. Some businesses are much farther along than others in their
performance management efforts, but chances are good some "if only's"
listed here resonate, as will some of the barriers below.
Methodical Approach
Organizations begin performance management initiatives at any point -
for example, one may begin with defining the corporate strategy and
determining KPIs to support it. Others will initiate a business
intelligence or data warehousing project. For many executives, a
scorecard without business intelligence behind it is their first step.
To achieve the best results, however, every phase – reporting,
management, and improvement should be done comprehensively. For example,
if a business is reporting on its global financials, but doesn't take
currency rate fluctuations into consideration, it is not seeing the
whole picture. If business units are not aligned around corporate goals,
improvement efforts (in the wrong direction) could be harmful. If
analytics are applied to improve performance by accurately forecasting
demand, but the information isn't shared with Sales, Marketing, and
Customer Service as well as Supply – the outcome could be devastating.
Regardless of where you begin, here are some of the gaps you might need
to fill in. (Please see
Barriers to Performance Improvement
By Becca Goren, SAS.
Our Server ).
[13]
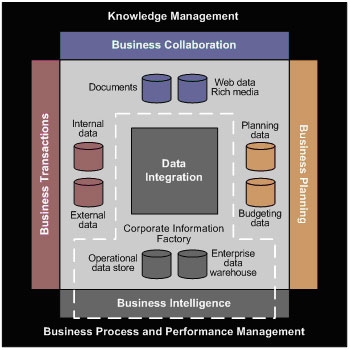
The Smart Business Intelligence
Framework
|
The Smart BI
Framework brings together the four forces that
drive business operations: people, plans,
processes and performance.
I’ve often made the point in my articles that
business intelligence is no longer just nice to
have, but is essential to business success. I’ve
also commented at the same time that business
intelligence applications and their underlying
data warehouses can only support the needs of
the business if they are tightly integrated into
the overall IT environment. To highlight the
importance of business intelligence and the need
to integrate it into the enterprise, I developed
the concept of the Smart BI Framework. The
latest version of this framework is shown in
Figure 1.
 |
|
|
|
The Smart BI Framework
brings together the four forces that drive
business operations and the IT systems that
support them. These four forces are people,
plans, processes and performance.
A company’s people are the underlying
foundation on which the business is built.
Without good employees a company will fail. How
people perform their role in the organization is
changing. The speed of business today means that
people can no longer sit in ivory towers, or
control and restrict the flow of information
within the organization. If information is power
then it must be made available to the people
that need it for their jobs.
Key to collaboration and the sharing of
information is knowledge management (KM), which
brings together portals, content management and
collaboration tools. The growing importance of
business intelligence also means that it too
must be integrated into the KM environment.
As senior executives define business plans
and goals they must communicate them down
through the corporate hierarchy. Targets must be
developed and measured, and employees must be
told what is expected of them. Employee
compensation should generally be tied to
achieving expected targets. Planning, budgeting
and forecasting systems form the basis of the
planning process, but collaboration capabilities
are required for communicating plans and goals,
and business intelligence is essential for
monitoring and managing targets. Methodologies
like balanced scorecards are also valuable for
formalizing the planning process and managing
targets.
Once business plans and initiatives are
agreed on, they are implemented in business
processes. Business process management is a
growing technology for modeling, simulating,
deploying, integrating and monitoring business
processes. At present, process management is
used primarily with operational business
transaction applications, but the need to manage
document and information workflows is bringing
process management concepts and technologies
into the collaborative application environment.
|
|
|
(Please see
The Smart Business Intelligence Framework
By Colin White B-EYE Network.
Our Server).
[14]
Putting the Business Back into BI
Although BI means “business intelligence,” it sometimes seems that
the technology interests supersede those of the business. If your BI
program gives more attention to dashboards, scorecards, OLAP, and data
warehouses than to finance, R&D, marketing, operations, and customer
support, then you likely need to put the business back into BI.
The sole purpose of business intelligence is to deliver information
that makes a difference—substantial, bottom-line business impact that is
achieved through increased revenue, reduced expense, and risks avoided.
The challenge of BI lies in making the connection between these business
goals and the information that is actually delivered. All too often, BI
delivers the metrics that are available, obvious, and easy, and misses
opportunities to deliver truly high-impact information. (Please see
Putting the
Business Back into BI By Dave Wells TDWI. Our
Server.)
[15]
Getting Started with Operations
Analytics
|
Summary: Even
sophisticated organizations are sometimes unsure
how to proceed with analytic applications. This
article uses a case study to define an analytic
application and characterize the problems
analytic applications are good at solving. It
then shows how analytics can deliver value to
the operations function.
As organizations mature in their use of data
warehousing/business intelligence (DW/BI)
solutions, many see the use of analytic
applications as a logical next step. Success
stories, such as credit scoring and fraud
detection in the credit card industry, are well
publicized and make analytic applications sound
wonderful. Yet many organizations, even those
that are quite sophisticated in their use of DW/BI
technologies, are unsure how to proceed with
analytic applications.
Analytic applications for operations,
sometimes called operations analytics, can be a
place to start.
What is an Analytic Application?
According to the dictionary, analytics is the
science of analysis. Generally, analytics refers
to analysis of data using Pareto analysis,
trending, seasonality, regression, correlation,
control charts and other statistical techniques.
Many DW/BI solutions provide analytic tools and
techniques in their data marts.
An analytic application is a step upward in
sophistication from merely providing analytic
techniques or tools:
- It automates the thinking and, in most
cases, a portion of the decision-making of a
human being.
- It typically uses complex quantitative
techniques, such as multivariate regression
analysis, data mining, artificial
intelligence or nonlinear programming.
For example, an analytic application used for
credit scoring might:
- Calculate a credit-worthiness score.
- Automatically accept or deny the credit
application.
- Select the credit limit.
- Select which credit card product
(interest rate, payment terms, etc.) to
issue this applicant.
Good Candidates
Some characteristics of business problems for
which an analytic application enabled by DW/BI
is a good solution include:
The optimal decision is based on
quantitative data and requires sophisticated
analysis of multiple interrelated variables.
Problems for which the solution is best
determined using the skilled judgment of a human
expert are not good candidates for an analytic
application (unless the expert's judgment can be
reduced to a set of rules for an artificial
intelligence-based analytic application).
Similarly, if the problem can be well solved by
simple quantitative techniques (such as adding
two numbers, for example), there is no need to
have an analytic application.
If the optimal decision is based on subtle
statistical interrelationships among ten or more
variables, then an analytic application may be
able to produce better solutions than a human
decision-maker.
The problem to be solved is central to the
organization. An initiative to provide an
analytic application will receive more interest
and support if the problem it solves is critical
to the profitability of the business or, in the
case of governmental or not-for-profit
organizations, closely tied to the mission. For
example, both a manufacturing company and a bank
may have an analytic application for cash
management. For the manufacturing company,
managing cash is important in order to be able
to meet payroll, pay suppliers according to
payment terms, etc., but is an administrative
process performed by the treasury function. For
a bank, on the other hand, having the right
amount of cash on hand is critical to customer
service (being able to service withdrawal
requests), meeting reserve requirements and
maximizing investment revenue (funds set aside
to support operations are not invested and,
therefore, are not earning a return). A cash
management analytic application is much more
central to the bank than to the manufacturing
company. |
|
|
(Please
see Getting Started
with Operations Analytics By Bill Collins and Richard Keith
DecisionPath Consulting.
Our Server.)
[16]
Business Intelligence - Beyond the
Software
While there is no one definition of business intelligence, there
appears to be general agreement on what it does: it converts operational
data to knowledge, providing meaningful information that facilitates
effective decisions aligned with firm strategy. Offering unlimited
analytical potential, BI is most successful when implemented with the
support of senior management as part of a change initiative, often in
the areas of enterprise performance management that employs elements of
the balanced scorecard.
Firms employing BI can effectively communicate strategy on a
real-time basis firm wide through a combination of dashboards,
event-driven reporting and report alerts reflecting specifically
selected key performance indices (KPI) aligned with firm or business
unit strategy. Strategy-linked performance measures guide individual
firm members to take timely actions when actual results fall short of
expectations. (Please see
Business
Intelligence - Beyond the Software By Steven Campbell
International Legal Technology Association.
Our Server.)
[17]
12 Tips for Generating Rich Data
Here, a guide to uncovering the bounty
buried in your data warehouse.From
CRM Magazine
Business intelligence (BI) applications have come a long way over the
past 10 years. More commonly known as data mining a decade ago, analysts
back then predicted a boom for this software market. Only today is that
boom starting to materialize.
Already, industry pundits posit that 60 percent of companies have
data-mining or BI systems installed. Of those 12 percent say they use
their software at least once every hour, while 36 percent say they use
it at least once each day, according to Ventana Research. It may come as
no surprise that those who install data-mining software weren't
necessarily getting the most out of it or the data, for a variety of
reasons. Alton Adams, a partner at Accenture's CRM practice, says, "Even
today people are still struggling to get it right. At its foundation
data mining is all about having a good understanding and a single view
of the customer to effectively market and sell to that customer. But
we're just not there yet. There is probably a litany of things that
people are doing wrong and things that they should be doing right.
There's still so much work to be done."
Similar to mining for gold, when done well data mining can extract a
treasure trove. Here are 12 tips experts and users say will help you
uncover the precious elements in your data.
1) Share data with caution
As Robb Eklund, Oracle vice president for CRM product marketing, says
data (both from internal and external sources) is your business's gold.
And data about your customers is especially valuable and sensitive. If
it's leaked or lost your business image as well as bottom line will
suffer, something MasterCard International found out this past May when
more than 40 million customers had their account information exposed.
Aside from the obvious--building security features into your database
and providing users and your database with a secure connection using
trusted IP addresses--you can prevent problems by creating limits and
rules for each user. Know who has access to what and why.
2) Look beyond transactional data
It's a given that your CRM and analytics programs will use data
collected from transactional and application systems, but there's plenty
of other nontraditional data out there that can bring added insight to
your employees, according to Anne Milley, director of technology product
marketing for SAS. You can purchase demographic and psychographic data
from outside vendors and there's data you can collect on your own, such
as market research, customer surveys, and focus group results. Another
data source is full-text conversations from your customer service or
call center. Today, there's software available from companies like Utopy,
Nexidia, and CallMiner that can turn dialogue into reliable quantitative
data that can be used to predict future customer service problems, as
well as help agents with cross- and upsell techniques. "You have to get
out of the database mentality," Milley says. "Transactional data is
fine, but as far as analytical richness, it's very limited in what it
can provide."
3) Clean your data regularlyThere are many kinds of dirty
data. Some of the most basic--having multiple entries for the same
customer or misspellings--can be the most labor-intensive to remove.
Other cleansing issues stem from organizational problems. Your marketing
department might classify data one way with one naming convention, while
your sales department uses another. But it all goes back to policies:
Require all users to input data the same way, and clean data often,
deleting mistakes and duplicates.
Kyle Lambert, vice president of information solutions for John I.
Haas, a grower and supplier for the beer industry, says sometimes, dirty
data can be the impetus to get a CRM or analytics project moving. "We
found that exposing dirty data to executives was much more powerful than
just cleaning our data," he says. "After we cleaned the data executives
would come back and say 'The IS department can't deliver any meaningful
information anyway.' But if we showed them we could deliver the data but
it was dirty, they started to correct the processes [that made it
dirty]. Executives love to change processes. They were able to
contribute to the improvement. And over time they could see the numbers
were getting better."
4) Distribute data at every level
You already know that your marketing and sales staff can benefit from
your CRM data, but you probably don't realize how useful it can be to
other personnel and departments, says Bill Stoughton, BI group leader
with database marketing services provider Merkle. "People just aren't
distributing data to the end touch points," he says. "Do you have enough
information going out to the call center or to your Web site for
customer self-service?"
Of course, someone working in the call center isn't necessarily going
to understand a detailed report or have direct access to your database.
To that end, being able to distribute reports in Microsoft Excel or Word
documents is key, according to Ventana Research, which found that 81
percent of users wanted the ability to export data to Excel. "We see it
all the time," says Patrick Morrissey, worldwide marketing director for
Business Objects. "It makes sense for the end user to see a report or
analysis in Excel, Word, or PowerPoint. It helps people use the data the
way that they work."
5) Fund training and relearning
You've spent millions on your CRM implementation, but do your employees
know enough about it to take advantage of the technology? In all
likelihood the answer is no, says Accenture's Adams. In fact, between 60
and 80 percent of companies don't have adequate training budgets. "We
find this is the biggest gap. Companies are not optimizing their spend
and effectively operationalizing their CRM programs. Train those who
will be working directly with the software, as well as those who will be
using and benefiting from reports. Many vendors offer free or online
training, which will keep your capital outlay low."
6) Balance server space with strong analysis
How much data do you have in your database? Three months' worth? Six
months' worth? Your goal really should be 13 months' worth, according to
Merkle's Stoughton, and at least three years' worth of contact data
information. Some data should always be accessible. "People tend to have
too much data so they aggregate it, but when you aggregate data, you're
losing data somewhere. Keep point-of-time information accessible, for
example, data that marks major events in a customer's life with
you--when they became your customer, when you last marketed to them."
7) Aggregate, don't delete
Dr. Judy Bayer, director of advanced analytics for software vendor
Teradata, agrees that you should keep a minimum of two to three years'
worth of data in archived files, but in the best case you should have
all of your data available somewhere. "I've worked with customers who
had thrown out data about people who aren't their customers anymore,"
Bayer says, "but how can you figure out why they are not your customer
if you don't have their data?" A rule of thumb: Analyze data before you
aggregate it--never simply throw data away.
8) Standardize whenever possible
One of the first things Toshiba America Medical Systems (TAMS)did when
it installed its new software was standardize everything related to its
data. All the reports coming from the CRM program have the same look and
feel, thanks to a template. Everything gets a time and date stamp. "Our
vice president of marketing believes in this program. By standardizing,
it was a way to make sure all of the information used in analysis came
from our new data reports," says Diane Werner, a customer relationship
specialist at TAMS. A few years ago TAMS took this strategy even farther
by using standard file and document naming conventions that employ real
language to bypass numbers in favor of descriptive document names. "It's
very clear what each report is. We use descriptions by month, quarter,
half. We don't use technical names," Werner says.
9) Talk to your users often
How can you decide what to measure and what reports to implement if you
don't know what people need? Karen Williams, vice president of BI,
product marketing, at Cognos, says one of the biggest mistakes she sees
her customers making is that they don't create a partnership between the
users and the IT group. "There should be a partnership early on that
takes into account what business people want and what IT can deliver,"
she says. "Make users part of the purchase and the implementation.
Identify requirements--what information they need to do their jobs."
Mark Lack, planning and financial analysis manager at manufacturing
firm Mueller, constantly polls his users, asking what they need. This
process also ferrets out which reports and analyses are unnecessary,
saving you time and energy in the long run, according to Lack.
10) Get executive buy-in
Business change comes from above. One of the best places to start is
your board, John I. Haas's Lambert says. "Interview your executives and
find out what info they are looking at on a daily basis. I recently went
to our board of directors and asked how they wanted to measure the
company--what growth expectations were. Then I went to our executive
management and said, 'This is what the board wants to see, how are you
going to deliver that?' They told me their strategy. I asked, 'How do
you measure your success against your strategy?'" Those fundamental
questions start the ball rolling."
11) Create a continuity plan for your data
Barbara McMullen, director of the Institute for Data Center
Professionals (IDCP) and project manager at Marist College's Center for
Collaborative and On-Demand Computing, is in the process of implementing
such a plan right now. The reason? The IDCP has been around for more
than three years. In the beginning, it stored data using MySQL. Soon
after, IDCP hired a new employee who didn't have experience using the
database format and converted everything to Excel. Unfortunately, only
some of the data was ported, and soon after the truncated database
became the default database. All the data that wasn't converted was lost
forever. "We lost information about potential customers," McMullen says.
"We had a policy in place, but the person responsible for enforcing that
policy left. Now, when I see some of those databases that used to be
more robust, it really bothers me."
McMullen suggests having more than one main contact person for your
data, and having a clear line of command. Your policy should also have
strict guidelines about how it will be stored, deleted, and analyzed,
she says. And everything--including where your data is stored--should be
in writing. "You can't ask someone on their last day of work if
everything was turned over."
12) Treat your partners like employees
Mueller's Lack says his implementation succeeded in part thanks to his
software vendor, Cognos, and his consultant, the CD Group. "We had never
done anything like this before. There was a lot of trust that had to go
back and forth between [Cognos and CD Group] and our company. A good
relationship with the folks you're working with is key. You never want
to get into an adversarial relationship."
Lack says he assessed companies the way he would a friend. "Did the
consultants have the same ethics and values that we do? We found that
there was a certain genuineness to our project leads. It definitely came
down to gut feelings in some cases."
Uncovering the treasure trove
Customers in the retail world who buy pretty floral Capri pants may not
shop for delicate, fringed ponchos, but unless you have a strong CRM and
analytics program, you wouldn't know that. Catalog retailer Newport News
knows this firsthand. A decade ago the company had rudimentary
information about its customer base--what it bought, what catalogs
customers purchased from, and where customers lived. But with millions
of customers who could be sliced into more than 800 segments--not
counting a creditworthiness category--they needed a little more data.
The major problem was, analysts spent 90 percent of their time
extracting data and only 10 percent actually analyzing it. As a result,
Newport News wasn't getting the most out of its data. Customers weren't
segmented as deeply as they could be, which detracted from sales, says
Van Rhodes, Newport News' manager of marketing decision-support systems.
And the analysis that was completed was often out of date. Even worse,
the company, which like other catalog retailers buys mailing lists,
never knew which lists were most beneficial. The company simply wasn't
getting the most out of its advertising dollars. "In the catalog
business we are forever buying each other's lists," Rhodes says. "We
might buy a list from Chadwick's or Victoria's Secret. We're interested
in how those lists are performing, but we just didn't know because we
couldn't do the analysis."
In an effort to boost its analytics, Newport News contracted in 2002
with SAS, creating a full-blown data warehouse and installing SAS's
analytical tools. Almost immediately the company saw big results.
Although Rhodes doesn't have specific ROI metrics, he says his new
system along with the best practices that he's implemented have paid for
themselves already, especially a statistical modeling feature, which
helps his company find and market to its strongest customers. "The
number one benefit so far is the speed of getting [our users] the
answers they need and the ability to give them data that they couldn't
see before."
Today, Newport News employees can identify buying patterns as they
are emerging, which lets them send out catalogs that are tailored to
customer needs. "With statistical modeling you can slice the customer
database so you can rank the entire database best customer to worst
customer," Rhodes says. "And now you can slice the customer so much
finer that you know, for example, why customer A is better than customer
B."
Newport News also knows which products each customer is more likely
to buy, which helps it mail out the right catalogs. It has helped with
the company's email marketing programs, something that didn't exist only
a few years ago. --K.B.
(Please see 12 Tips for Generating Rich Data.
Here, a guide to uncovering the bounty buried in
your data warehouse.
)
[18]
THE ESSENTIAL INGREDIENT:
How Business Intelligence depends on data quality
Mat Hanrahan A DCR Data quality resource
1.0 Executive summary
• Business Intelligence (BI) is about identifying competitive
advantage from business data.
• BI tools give business analysts the opportunity to examine how
changes to the cost, production and selling of
a product or service can affect the margin of profit it supports.
• BI tools traditionally delivered long-term ROI for companies
that could benefit from economies of scale. Today, however, a
wide range of companies are accumulating large amounts of data on both
their customers and their product lines and hoping to benefit from BI
technology.
• Despite all this growing interest in BI, many companies are still
ignoring the fact that a BI tool is only as good as the
quality of the data it is processing.
• Data quality problems are common throughout business, but BI is
particularly sensitive to them. Poor quality data will undermine the
integrity of the tools used by experienced analyst, while less
experienced users have the potential to base important decisions on
inaccurate data, with potentially disastrous results. Both
problems will cripple any ROI estimates of the tool.
• Attempts from the suite vendors to position ‘embedded BI’
functionality into their products will be particularly susceptible to
this problem.
• BI can only become a truly commodity product if the customer knows his
data assets and what they can be used for.
• BI functions used alongside data quality tools can produce valuable
commercial opportunities. BI can become an active danger when it is not
using data of a known quality.
2.0 Business Intelligence: an introduction
The heart of Business Intelligence (BI) is the ability of an
organisation to access and analyse information, and then exploit it to
competitive advantage.
Competitive advantage is sometimes difficult to separate from the
characteristics of a particular market and those who compete within it.
Despite this, the commercial pressures of a mature market can be
formidable, and competing companies must often adopt similar strategies
if they are to survive. In this kind of market, commercial advantage
will depend on striking a precise balance between three factors:
• the price and quality of a product or service
• the cost of producing and selling the product
• the margin of profit that can be supported by customer demand for
the product
Business Intelligence and Business Analytics tools aim to help business
analysts identify areas of competitive advantage through exploring how
these three factors interact. The most typical approaches to
improving efficiency are:
• Identifying products, customers and sales channels that return the
highest profit margins, and moving resources to them from their
low-margin equivalents.
• Identifying and adjusting costs in the production and provision of
service.
• Recalibrating estimates of overheads and expenses in ways that are
easier to define and control.
• Building a working model of the business across departmental
divisions, and using it as a yardstick for improving efficiency.
• Forecasting variations in buying patterns across different types of
customers, products and time lines, and adjusting marketing strategy and
supply chain logistics accordingly.
BI tools are traditionally associated with specialist vendors
that produce data-mining, data analysis, forecasting
and decision support products. Decent BI tools:
• Provide full and independent access to data from across the full
range of the business
• Have minimal or zero impact on operational IT infrastructure and
require little support from the IT department.
• Are driven by business analyst rather than IT experts
• Have a flexible and extensive selection of features that can be
quickly brought to bear on any problem.
Although BI tools often generate immediate return on investment (ROI) by
identifying significant and costly inefficiencies during configuration,
they deliver most value as a long term investment. In November 2002 IDC
published a survey of ‘The Financial Impact of Business Analytics’ that
stated BI implementations generated an average 5 year ROI of 431%, with
over half (63%) of those studied delivering ROI in two years or less(1).
This kind of significant long-term ROI comes from understanding how
precise, incremental
changes can bring competitive advantage to a business. A decade ago,
when storing and sharing data was a still a relatively expensive
business, the companies that had the most to gain from the kind of
subtle, incremental adjustments were those big enough to benefit from
the economies of scale. Today, in our networked age of throwaway
circuitry, even a mid-sized enterprise can accumulate mountains of data
about their customers and product-line for almost negligible cost. It
should be no surprise therefore that there is a new and growing interest
from all sectors of industry in how this data can be exploited, and that
BI is being seen as a must-have for any business with an eye on the
future.
BI and analytic tools bring competitive advantage to the modern business
in two key ways.
Enterprises are investing in CRM analytics(2) in order to
consolidate and deepen the understanding they have of their customers as
a result of loyalty cards, call-centres and Customer Relationship
Management (CRM) systems.
At the same time, enterprises are trying to drive efficiency through
both the supply chain and the sales and service channels by using
technology such as Radio Frequency ID (RFID) to collect more and more
data on the products that they sell.
The explosion in data collection, the growing ruthlessness and
efficiency of competition and the plummetting cost of both hardware and
software is also pushing BI into new markets. Where BI was once the tool
of the high-level strategist, today the ‘suite’ vendors are marketting
‘embedded BI’ as a value-add commodity for the SME(3). BI
features are being adopted by database products, CRM and human resources
suites, and supply chain applications as vendors adopt increasingly
predatory tactics in a changing market.
Yet, for all the undoubted drama and promise of BI, few commentators
acknowledge how completely dependent it is on another aspect of business
the industry prefers to ignore.
BI tools are only as good as the data which they process: if the data is
of poor quality the results will be inaccurate. This can have major
implications for business.
3.0 Data Quality and Business Intelligence
There are many reasons why data quality is the most overlooked issue in
modern IT. Changes in regulatory compliance and the growth of
‘info-centric’ architectures may have recently made data quality issues
a concern of the board(4), but in the past businesses often
preferred to leave the job of sorting out occasional inaccuracies of
their data to the individual discretion of staff. This often left the
business analyst in a very difficult position.
Quality data is the most essential working material of the business
analyst. A question over the integrity of some of the data used in a
calculation will at the very least, turn a certainty into a mere
probability. Cast doubt over the integrity of more than one source and
the analyst is going to be hard put to produce anything that might not
actually mislead.
There is real danger here: a company that gambles on a new commercial
strategy that is underpinned with misleading intelligence can do itself
irreperable damage.
Business analysts and BI users have always been aware just how dependent
they are on the quality of the data they interrogate. However the low
visibility of the data quality issue meant they were often left to act
on their own initiative, and the workarounds they developed would often
detract from the value of the investment in BI and analytic tools.
Much of the strategic attraction/value of a BI tool comes from the way
it can bring visibility to interdepartmental processes without incurring
the considerable headache and expense of investing in operational
networks. Enterprise-wide visibility is a worthy and valuable goal, but
although the concept is an easy one to sell putting it in place on the
ground is a very different matter.
Data quality is key here. Data warehouses traditionally always needed
co-operation from the data-owners before they could agree on a common
structure with which to organise their data before sharing. Recent
innovations in data profiling have made this task far easier than it
was, but the focus still tends to be on the format and form of the data
rather than the accuracy of its content. Inter-departmental politicking
is common across businesses and many data-owners refuse on principle to
admit the quality of their data is anything less than 100% accurate.
Data quality remains a nettle that enterprise is often reluctant to
grasp(5).
The result is that data quality problems are rampant. A survey from
Price Waterhouse Coopers in 2001 stated 75% companies had data quality
problems(6), while a report from The Data Warehousing Institute
in 2002(7) estimated data quality problems cost US businesses in
the region of $600 billion a year. Ted Friedman of Gartner stated that
poor data quality was not only a major factor behind the failure of
Business Intelligence, CRM and other data sharing initiatives, but that
it was causing ‘constant levels of pain’ in enterprise even without
taking these failures into consideration. He went on to claim Gartner
estimated that by 2006, there was high probability that Fortune 1000
enterprises will lose more money in operational inefficiency due to data
quality issues than they will spend on business intelligence, CRM, and
ERP initiatives(8).
BI is particularly sensitive to poor data quality. Decent analysts, the
kind that are capable of identifying a slender margin worth millions of
dollars, need to have a low tolerance for inaccurate data. Those with a
sharp eye for suspect figures may simply blame the BI tool and stop
using it, taking reliable data offline and working on it in a private
spreadsheet. Both choices dilute the effectiveness of the tool and
cripple its ROI.
The analysts without the eye for bad data are an even bigger concern.
Supply these people with a BI tool and order them to crunch data of
unknown quality and there is a very real risk inaccurate information
will start finding its way into important business decisions.
The new market for ‘embedded analytics’ increases the risk. BI functions
are now being opened up to users who have a limited view of the business
and minimal training, who can now produce re-assuringly precise
statistics at the click of a mouse.
For the suite vendors ‘embedded analytics’ is a marketing necessity, a
way of working themselves up the bank and into the richer margins of an
adjacent pond. Their marketing campaigns present the data layer as an
inert, passive resource at the bottom to be transformed,
manipulated and passed at will around by the business and application
layers above(9).
Today, businesses are waking up to the fact that the data layer, far
from being inert, is the primary business asset from which the
overarching layers must take their orders – and that there are major
business benefits from taking a systematic approach towards
understanding the quality of the data they use(10). Little wonder
then that Meta Group stated in a market sector analysis in
September 2003 that the data quality market would grow at a compound
rate of 30% a year(11).
4.0 Why BI needs DQ
Data can go bad in many different ways.
It can be inaccurate, incomplete and out of date.
It can be used out of context and or changed deliberately
or accidentally.
Bad data already damages business. It can interfere with the
processes that take place within a business and the processes
that take place between businesses and customers. It can waste
marketing resources, damage a company’s reputation and
make it vulnerable to both litigation and fraud.
The following examples are based on actual incidents and are typical
of the way poor quality data can damage a business..
The director of a promotions and marketing has been with a
company for eight years. He originally started out in sales. He has a
good understanding of the business and knows from past experience that
the till scanners can generate anything up to a 10% margin of error on
the official sales figures, and consequently has an instinctive distrust
of the official sales data. When the time comes to write his quarterly
report he uses his personal contacts within both sales and marketing to
double check the facts, and then generates his figures on a spreadsheet
– and continues to work in this way even when the BI tool is introduced.
He is unaware that approximately 12% of his marketing and mailing
budget is being wasted per year by mailing promotional offers to
incorrect addresses.
The regional marketing officer is new to the business and still
finding her bearings, but keen to make her mark in her new role. The
Managing Director mentioned they were investing in a new BI tool during
the job interview and the new appointee sees it as key to her future
within the business. The BI tool is both her ticket to understanding the
inner-workings of the business and a means of gaining ground on more
experienced colleagues. The training in the tool will also look good on
her CV if the job does not work out.
From the beginning the precision of the statistics the BI tools produces
makes a strong impression on her, and takes the opportunity to
interrogate the BI tools whenever possible. She takes all the statistics
at face value, secure in the knowledge that, as a new employee, if there
are any mistakes, they were made before she joined the company. She has
already uncovered some interesting oversights: for some reason her
predecessor has been ignoring the fact that 37.8% of the customer base
are retired. She sees an opportunity to make her mark, and begins
quietly using the BI tool to profile the spending habits of this
valuable demographic and target them with a marketing campaign. She does
not realise is that 70.4% of this demographic is a totally random
grouping caused by call centre operatives choosing the ‘retired’ option
in Date Of Birth drop down list because it is the quickest way to add a
value to the field.
The most successful of the sales representatives is paid mostly
on commission. He has a good mental picture of who his most valuable
customers are, and knows that most of them have more than one customer
record in the CRM system. He makes sure he consults all records before
he goes out on his visits. He’s also aware that a rival company is
targeting these customers with a high-profile promotional campaign and a
competitively priced product. Like the director of sales and marketing
he has to use his initiative to work the data, in this case by
organising the multiple views of his high value customers into a single
record, before he can try and identify a strategy that can stop them
leaving. By the time he has done this, however, the competition has the
third phase of its strategy in place, and a group of customers
representing 60% of his commission and 10% of the companies overall
turnover have already made their move.
The two most valuable customers were not slow to take the opportunity to
move their business elsewhere. They had nursed concerns about its
efficiency ever since they started receiving triplicate versions of
promotional literature.
A managing director needs to replace his most senior advisor, who
is retiring, and is hoping that technology will be able to take on part
of his role. He has read a few articles in the press about the falling
cost of analytics and bought an analyst report on the subject and, on
the strength of this, has decided to invest in the BI, with the ultimate
aim of developing a dashboard that would inform him in real-time about
the success and sales of the business. Unfortunately the picture this
dashboard gives is distorted by the poor quality of the data it
aggregates.
Duplicates of customer records have swelled the customer base by 15%.
‘De-duping’ these into a single customer record will not only speed the
increase the efficiency and agility of the company, it will also go some
way in helping to protect both companies and customers from fraud.
Similarly 12% of the addresses recorded are wrong. Cleaning the mailing
list he would save the marketing department 12% of their yearly mailing
budget. Errors in his pricing database are haemorrhaging 2% off his
production costs, while rethinking his pricing strategy could win him an
extra 15% of business.
None of this is visible, even with the BI tool. Without a
company-wide approach that sees data as a strategic business asset both
problem and its solution remain hidden away in departmental working
procedures and the personal agendas of the employees.
5.0 DATA QUALITY: THE KEY TO ANALYTICS
Business Intelligence tools are only as good as the data they use.
In the last two years the organisations that traditionally took the
initiative in data-warehousing and BI analytics have started to
recognise that the data within their systems is a strategic resource and
a valuable business asset(12). Many of these initiatives started
with the need to demonstrate compliance to legislation such as
Sarbanes-Oxley or Basle II, yet the need to demonstrate compliance has
provided both the incentive and momentum needed to drive the data
quality and data integration agenda past the barriers that traditionally
held it back. The result is that, far from being an overhead, for some
companies demonstrating compliance has resulted a marked improvement of
efficiency(13). Improved data quality has been an important
factor here.
The rise of complex services that use data from multiple strategic
partners has similarly driven interest in data quality. Customer-facing
service providers are acutely aware of the value of being able to
independently assess the accuracy of the data before passing it on to
their customers(14). Similarly, success within a merger or
acquisition activity is often dependent on the speed with which each
party can understand and exploit the value of the new data assets.
Yet despite all this, it is BI - so long a hostage to poor data quality
- that may well deliver the broadest and widest gains from a systematic
approach to understanding data quality. Today, BI tools are more
affordable than ever before. They are intuitively designed, flexible,
fast and invariably packed with rich feature-sets.
BI has obvious potential as a strategic application, but this potential
can only be realised if the customer knows his data assets and how they
can be used.
Used in conjunction with data quality tools, BI has the potential to
change the shape of a market. Used without, at best it is an expensive
vanity - at worst, a misleading liability that can harm your business.
(Please see THE ESSENTIAL INGREDIENT:
How Business Intelligence depends on data quality
) & (Principles of Information Quality Improvement. By
Larry P. English )
[19]
Designing Executive Dashboards, Part 1
By Thomas Gonzalez
Introduction:
Corporate dashboards are becoming the “must
have” business intelligence technology for
executives and business users across corporate
America. Dashboard solutions have been around
for over a decade, but have recently seen a
resurgence in popularity due to the advance of
enabling business intelligence and integration
technologies.
Designing an effective business dashboard is
more challenging than it might appear due to the
fact you are compressing large amounts of
business information into a small visual area.
Every dashboard component must effectively
balance its share of screen real estate with the
importance of the information it is imparting to
the viewer.
This article will discuss how to create an
effective operational dashboard and some of the
associated design best practices.
Dashboard Design Goals:
Dashboards can take many formats, from glorified
reports to highly strategic business scorecards.
This article refers to operational or tactical
dashboards employed by business users in
performing their daily work; these dashboards
may directly support higher-level strategic
objectives or be tied to a very specific
business function. The goal of an operational
dashboard is to provide business users with
relevant and actionable information that
empowers them to make effective decisions in a
more efficient manner than they could without a
dashboard. In this context, “relevant” means
information that is directly tied to the user’s
role and level within the organization. For
instance, it would be inappropriate to provide
the CFO with detailed metrics about Web site
traffic but appropriate to present usage costs
as they relate to bandwidth consumption.
“Actionable” information refers to data that
will alert the user as to when and what type of
action needs to be taken in order to meet
operational or strategic targets. Effective
dashboards require an extremely efficient design
that takes into account the role a user plays
within the organization and the specific tasks
and responsibilities that user performs on a
daily/weekly basis.
Defining Key Performance Indicators:
The first step in designing a dashboard is to
understand what key performance indicators (KPI)
users are responsible for and which KPIs they
wish to manage through their dashboard solution.
A KPI can be defined as a measure (real or
abstract) that indicates relative performance in
relationship to a target goal. For instance, we
might have a KPI that measures a specific
number, such as daily Internet sales with a
target goal of $10,000. In another instance we
might have a more abstract KPI that measures
“financial health” as a composite of several
other KPIs, such as outstanding receivables,
available credit and earnings before tax and
depreciation. Within this scenario the
higher-level “financial” KPI would be a
composite of three disparate measures and their
relative performance to specific targets.
Defining the correct KPIs specific to the
intended user is one of the most important
design steps, as it sets the foundation and
context for the information that will be
subsequently visualized within the dashboard.
|
|
|
(Please see
Designing Executive Dashboards, Part 1
By Thomas Gonzalez, BrightPoint Consulting.
Our Server )
[20]
Designing Executive Dashboards, Part 2
By Tom Gonzalez
Introduction:
In
part one of this series we covered
the basic requirements of a corporate dashboard
solution and went on to discuss the first steps
of the dashboard design process. The two main
areas covered were determining the appropriate
key performance indicators (KPIs) and how to
design a dashboard with the five most common KPI
visualizations: alert icons, traffic lights,
trend icons, progress bars, and gauges. In this
article we complete the design process and cover
visualization of supporting analytics and the
layout techniques used to create a visually
efficient and compelling design.
Supporting Analytics:
Supporting analytics are additional data
visualizations that a user can view to help
diagnose the condition of a given KPI or set of
KPI’s. In most business cases these supporting
analytics take the form of traditional charts
and tables or lists. While the scope of this
article is not intended to cover the myriad of
best practices in designing traditional charting
visualizations, we will discuss some of the
basics as they relate to dashboard design.
When creating supporting analytics, it is
paramount that you take into account the typical
end user who will be viewing the dashboard. The
more specialized and specific the dashboard will
be the more complexity and detail you can have
in your supporting analytics. Conversely, if you
have a very high level dashboard your supporting
analytics will generally represent higher level
summary information with less complex detail.
Below we will discuss some of the most common
visualizations used for designing supporting
analytics.
- Pie Charts: Pie charts are
generally considered a poor data
visualization for any data set with more
than half a dozen elements. The problem with
pie charts is that it is very difficult to
discern proportional differences with a
radially divided circle, except in the case
of a small data set that has large value
differences within it. Pie charts also pose
a problem for labeling, as they are either
dependent on a color or pattern to describe
the different data elements, or the labels
need to be arranged around the perimeter of
the pie, creating a visual distraction.
When to use: Pie charts
should be used to represent very small
data sets that are geared to high level
relationships between data elements.
Usually pie charts can work for summary
level relationships but should not be
used for detailed analysis.
- Bar Charts: Bar charts are an
ideal visualization for showing the
relationship of data elements within a
series or multiple series. Bar charts allow
for easy comparison of values due to the
fact that the “bars” of data share a common
measure and can be easily visually compared
to one another.
When to use: Bar charts
are best suited for categorical analysis
but can also be used for small time
series analysis (e.g. the months of a
year.) An example of categorical
analysis would be examining sales of
products broken down by product or
product group, with sales in dollars
being the measure and product or product
group being the category. Be careful in
using bar charts if you have a data set
that can have one element with a large
outlier value; this will render the
visualization for the remaining data
elements unusable. This is due to the
fact that the chart scale is linear and
will not clearly represent the
relationships between the remaining data
elements.
|
|
|
(Please see
Designing
Executive Dashboards, Part 2 By Tom Gonzalez, BrightPoint
Consulting.
Our Server.)
[21]
Tactical Issues and Best Practices
By Stephen Hunt
Accenture Finance executives can gain immediate benefits from tactical solutions and
best practices that enable operational managers to adopt forecasting and
budgeting processes as key management tools.
Ask most CFOs and finance directors to describe an ideal forecasting and
budgeting process, and they’ll likely portray it as part of an overall
integrated performance management framework, ultimately driven by value-based
measures. At the same time, however, they’ll admit that this vision involves a
significant transformation to their current forecasting and budgeting processes,
systems, and organization. Accenture’s experience shows it can take three to
five years to fully implement and embed these changes.
Meanwhile, finance organizations face a more immediate problem. Legacy
systems and processes that have been in operation for the past 10 years are
often broken. Despite significant efforts, they can no longer support the
dynamic changes affecting the business. Increasingly, then, the question
becomes, “What practical steps can we take to improve or replace existing
processes and systems?” — usually combined with “before we start the next
budgeting cycle.”
The good news is that tactical solutions deliver significant and usually
exponential benefits. However, tactical solutions should not detract from
pursuing a longer-term strategic forecasting and budgeting solution that is
aligned to the overall strategy and business requirements. In fact, tactical
initiatives, delivering quick wins and visible benefits, are essential in
obtaining support and sponsorship for an overall strategic initiative.
As with any longer-term solution, successful tactical initiatives also
require strong executive sponsorship, a robust and proven approach, a persuasive
business case, and a significant change to the way the organization views and
operates the forecasting and budgeting process.
Articulating the Issues
Although issues with the existing forecasting and budgeting process and systems
are often well-known, it is important to fully document and communicate their
impact to gain executive sponsorship, drive momentum for change, and ensure that
the benefits are understood (see Figure 1). This is especially true since many
of the benefits are qualitative and focus on accuracy and accountability.

Figure 1: Budgeting and Forecasting Issues
Frequency and Timeliness
Annual forecasting and budgeting cannot keep pace with today’s dynamic business
environment because the information produced is often out-of-date and
irrelevant. Managers need to be able to understand and respond quickly to the
impact of competitive forces and rapid changes affecting their business, yet
most organizations fail to forecast the financial impact of these changes fast
enough.
All too often, the end-to-end process takes too long. Quarterly forecasts
take two to five weeks to finalize. Budgets are often not finalized until well
into the actual year they are purported to budget. Similarly, the time taken to
produce each iteration of the forecast or budget is too long, frequently taking
days and sometimes weeks. In today’s environment, the impact of any change to
the financials needs to be understood within the day or even the hour.
It is surprising that the need for faster delivery of forward-looking
forecasts and budgets has not received more attention, especially in light of
the time and effort spent implementing ERP solutions and the drive toward a
faster close, which, by definition, provides backward-looking information.
Flexibility
Most forecasting and budgeting processes and systems lack sufficient flexibility
to accommodate the reorganizations, divestitures, mergers, and acquisitions that
have become the hallmark of contemporary business. These changes need to be
modeled and reflected within forecasting and budgeting systems, both in the
future and also retrospectively to ensure relevant prior-year comparisons.
Without this flexibility, finance professionals spend significant time and
effort restating the numbers.
In recent years, this effort has become so immense that more and more
organizations choose not to make restatements, deciding instead to highlight
them via footnotes within the forecast and budget documentation, which makes
historical comparison and trend analysis of questionable value.
In addition, most systems are not flexible enough to accommodate the demand
for multiple views of forecast and budget information. Consequently delivering
slice-and-dice views of data and what-if analyses requires time-consuming,
offline data manipulation.
Cost and Effort
The cost of existing forecasting and budgeting processes is significant and
appears to be growing every year. Accenture’s Planning for Value research study,
conducted in conjunction with Cranfield University, found that the budget
process for lower-quartile companies takes longer than six months. Similarly, $1
billion companies take, on average, 25,000 man-days to complete their budget.
Accountability and Ownership
The finance function is so involved in forecasting and budgeting that it becomes
the owner of the process rather than the facilitator. “These are not my numbers”
is a regular cry heard when operational management reviews forecasts and
budgets. This has much to do with last-minute changes made without the agreement
of all those involved.
Transparency and Access
Lack of accountability also relates to the lack of transparency and access to
information offered to operational management. Operational managers work hard to
produce information but may receive little or no feedback after the numbers are
submitted and, thus, cannot easily view the forecast and budget information
presented to senior management. Often they are also unable to access the data
for modeling or examination. As a result, they see the forecasting and budgeting
process as an effort by the finance function to collate and aggregate bottom-up
data, turning it into “just another management request for information.”
Accuracy
Forecasts and budgets are often inaccurate. Despite technological advances, most
organizations use a patchwork of spreadsheet models to undertake their
forecasting and budgeting, with multiple hand-offs and revisions throughout the
process. Inaccuracies arise due to lack of version control, transposition of
numbers, and unallocated numbers (“buckets”) with aggregated data not equaling
the sum of their parts. The impact is significant, leading to a lack of
confidence in both the numbers and the ability of the finance function to
deliver.
This impact extends to the analyst community as well, creating potentially a
far greater cost to the organization. Empirical research tells us that
shareholder value is materially affected when companies fail to provide accurate
projections of business performance.
Finance Skills and Morale
Trying to manage such a problematic process often takes a toll on those involved
and has a negative impact on how the finance function is perceived. Though
forecasting and budgeting is often managed and operated by highly qualified
finance professionals, the function can be relegated to nothing more than a
factory for producing numbers. Rather than focusing on delivering value-added
analysis, the finance function spends a disproportionate amount of time and
effort cranking the numbers through multiple iterations using ill-equipped
mechanisms and processes.
In summary, these issues combine to deliver a forecasting and budgeting
process that takes too long, costs too much, and is too manually intensive. To
make matters worse, the resulting forecast or budget is typically inaccurate,
lacks accountability, and is out-of-date by the time it is produced.
Applying Best Practices
Although much has been written about best practices in budgeting and
forecasting, most of it has been academic, until recently (see Figure 2). Now,
however, technological advances offer capabilities that enable many best
practices to be delivered.
Figure 2: Budgeting and Forecasting Best Practices
The following best practices are increasingly being adopted by organizations
to solve common forecasting and budgeting issues. Importantly, no one best
practice is a panacea for all the issues mentioned. Only by implementing a
combination of these practices can organizations really begin to overcome the
problems they face.
Rolling Forecasts
Traditionally, the budget process has been a one-off event, albeit a long and
arduous one, and the forecasts, though more frequent, remain as a series of
one-off quarterly events.
However, significant gains can be made from eradicating this single
period/annual mindset and moving to a rolling forecast approach. Operations do
not switch off on Dec. 31 each year and start afresh on Jan. 1. Customers do not
think of your business in this way, so why monitor and manage the business in
such discrete timeframes?
The first step in implementing rolling forecasts is to define what is meant
by a “true rolling forecast.” Figure 3 best illustrates the concept of a
12-month rolling forecast. As each additional month’s actual information is
finalized, the forecast is updated to provide an additional month’s forecast,
thus always providing a 12-month projection into the future.

Figure 3: A True Rolling Forecast — Blue bars indicate actual results.
The move to rolling forecasts provides a number of benefits, in particular:
- Reducing or eliminating the traditional approach of the previous period
plus an uplift. This approach forces the individuals undertaking the
forecasts to update their business projections each month and embed the
activity in monthly procedures;
- Helping to eliminate the annual mind-set and focus on the current year,
acknowledging that the business functions as an ongoing operation and needs
to be managed accordingly;
- Providing a continual 12-month business outlook at all times, enabling
management to take remedial action as forecast business conditions change;
- Eliminating the unrealistic December-to-January gap that appears when
next year’s budget is calendarized for the first time. By undertaking
rolling forecasts, the December-to-January forecast is no different than any
other two-month period; and
- Reducing or potentially eliminating the annual budgeting process. At the
normal budget time, management will already have a very good idea of what
the following financial year will look like from their latest rolling
forecast. For example, an organization operating a 15-month rolling forecast
will already have, at the end of the third quarter, a complete projection of
the next financial year.
An alternative to a true rolling forecast is a “fixed period rolling
forecast,” with which a number of organizations operate. Although this approach
has the benefit of ensuring that forecasts are updated monthly, the benefits
just described are not fully realized because the forecast remains focused on
the current period. The key problem with this approach is that the business
still has a fixed horizon — with associated performance management implications.
Increasingly, top-quartile companies have moved or are moving toward rolling
forecasts. This is no small achievement. Usually there is significant cultural
attachment to the forecasting and budgeting process, so the transition to
rolling forecasts should not be underestimated. A budgeting process, for
example, that starts in March and ends in August can become a raison d’être for
the finance organization during this time, with much political power and control
associated with the process.
In transitioning an organization towards operating rolling forecasts, a
number of practical issues must be addressed. Most importantly, it cannot be
done in isolation. It is not simply a matter of repeating on a monthly basis
what is currently undertaken quarterly or semi-annually. This message must be
communicated early in the process, or managers will worry that they “won’t be
doing anything else but forecasting all day.”
Transitioning to a 12-month rolling forecast immediately can prove difficult,
especially if the new process involves operational managers who have not
directly participated in the forecasting process before. If the organization
conducts forecasts semi-annually or less frequently, moving to a quarterly
forecast first is a sensible option. If the organization forecasts quarterly, an
approach to transition would be to first move to a rolling forecast with the
required detail for the first six months and then to quarterly totals for the
next six months.
In reality, the organization may be unwilling to completely discard quarterly
forecasting or annual budgeting activities. Indeed, more detail may be required
for quarterly forecasting and annual budgets due to external reporting
requirements. Rolling forecasts do not remove this need, but they do provide
management with timely information to support business decisions. Over time, the
existing spiked quarterly effort will — and should — reduce as the rolling
forecast becomes embedded in the monthly management of the business.
Increased Participation
Driving down the forecasting and budgeting process to operational managers has
gained more ground as the best way to ensure accurate and reliable forecasts.
Historically, any suggestion of this approach would have been met with
disbelief, giving rise to visions of even more data aggregation, longer cycle
times and increased manual handovers. However, technological advances in recent
years, most noticeably the Web, have given rise to a number of solutions that
are highly scalable to hundreds and even thousands of end users, enabling the
forecasting and budgeting capability to be placed in the hands of the business.
The advantage of this is obvious — those who can produce the best projections of
business activities are those who undertake and are responsible for those
activities.
For example, consider a bank with a large branch network where forecasting
and budgeting is likely to be done by the finance function at a regional or
group level, using tools and techniques available only to them. Today’s
Web-based solutions enable the process to be driven down to the regional or even
branch manager by providing little more than access to an Internet browser.
Of course, as with any new initiative, delivering sufficient practical
training to the end users is essential for successful adoption of the new
solution. Training should not be limited to the new technical solution alone,
but also to the underlying concepts of forecasting and budgeting. A recent
example of a forecasting and budgeting implementation saw the users receive a
half-day training session, only 15 percent of which was targeted at the use of
the technical solution. The majority of the session was focused on such basic
concepts as “What is a forecast?”, “What is the organization trying to achieve
with the forecast?”, and “Where and how do you get the underlying information?”
Detail Linked to Accountability
Another best practice is to link detail to those items that end users are
actually accountable for and which they control. In short, keep it simple and
relevant. Traditionally, finance professionals have gained comfort from the
detail. In fact, Accenture’s Planning for Value research study found that
bottom-quartile companies budget for more than 250 lines of detail. Projecting
at such a level of detail is not only unrealistic but also assumes a spurious
level of detail. In contrast, by linking detail to accountability, accuracy will
likely increase as operational managers forecast or budget items that they
manage and discuss on a day-to-day basis.
Returning to the banking example, suppose that the regional finance function
currently undertakes a forecast of regional and branch profitability. When
driving down forecasting and budgeting to the branch management, there is little
point in forcing branch managers to forecast profitability, since they have no
control over the pricing of mortgages or savings products their branch sells or
the cost of funds associated with them. What the branch or regional manager is
accountable for, however — and acutely aware of — is the number of mortgages and
savings accounts sold and managed by the branch.
Practically, the roles and responsibilities of operational managers should be
assessed to understand what common elements of the business model they are
accountable for and — just as importantly — for what elements they are not.
Driver-Based
Driver-based forecasting and budgeting enables the underlying business model to
be encapsulated within a standardized and structured forecast and budget
capability. The benefits can be significant and include:
- Releasing potentially hundreds of business users from building and
maintaining individual, usually spreadsheet-based, forecast and budget
models;
- Allowing common parameters to be incorporated within the models,
eliminating the need for end users to forecast items for which they are not
responsible;
- Ensuring transparency and providing modeling capabilities to operational
managers; and
- Providing management with the confidence that forecasts and budgets are
derived from one common modeling methodology and set of algorithms.
In addition, thought should be given to incorporating an upward reporting and
governance process for forecasting and budgeting into the model. To support
this, many of the new technical solutions provide for multiple hierarchies and
online workflow control.
Using the banking example, a driver-based modeling capability provided
locally to branch management would incorporate common information on price, cost
of funds, and central allocations. Local branch management could then forecast
the volumes of savings and mortgage products as well as branch costs, enabling
branch profitability to be calculated. Similarly, individual branch
profitability would then aggregate automatically through the reporting
hierarchies to provide regional, divisional, and country profitability.
Practically, investment is required upfront in taking time and effort to talk
to the various business stakeholders to ensure that the business model and
processes are correctly understood and can be translated into the appropriate
driver-based model.
End-User Analysis
Advances in forecasting and budgeting applications enable analysis and reporting
capabilities — not just data collection — to be deployed to a larger and widely
distributed base of operational end users. Previously, finance was the only
function with access to modeling tools, such as spreadsheets and business
objects, and the training and skills to use them.
In the banking example, a branch manager using a local forecast or budget
model could undertake what-if analyses to assess scenarios for deploying branch
staff to different activities. Providing analytical capabilities to local
operational managers gives them tools to manage and track their local business.
This helps empower local management and ensures buy-in to the new forecasting
and budgeting process.
Again, this requires upfront investment to understand the business
requirements of both operational management and senior management. This ensures
that operational managers receive a model with reporting and analytical
capabilities that help them run their local business. Building only the analysis
required by the corporate center into the forecasting and budgeting tool will
compromise the end users’ perception and successful adoption of the solution.
The Way Forward
While no one particular best practice solves all the issues, leveraging a
combination of best practices enables operational managers to adopt forecasting
and budgeting processes as key management tools.
To facilitate this greater level of involvement from operational management,
forecasting and budgeting processes and systems must be timely, relevant, and
useful to end users. No longer should the budget process be a one-off event that
is rushed through as an administrative chore.
In an ideal world, forecasting and budgeting processes and systems become so
embedded at the operational level that aggregating results for management is
merely a byproduct of operational managers using forecasting and budgeting tools
in their normal management routines.
Additional Information:
Stephen Hunt is a senior manager in Accenture's Finance and Performance
Management Service Line in London.
(Please see
Tactical Issues
and Best Practices By Stephen Hunt Accenture.
Our Server. ) |
|