by
Gary Parish

| The Electoral College: Source of Inequality and Social Injustice in America by Gary Parish |
|||||||||||||||||||||||
|
|||||||||||||||||||||||
| EXAMPLES OF ELECTORAL COLLEGE INEQUALITIES |
� One Person One Vote Myth � Fundamentally Unfair! � See For Yourself! � Social Injustice � Football Analogy � Moral Arguments � EC Cancels Votes � Founding Fathers � Invalid Arguments For EC � States' Rights? � Reform Options � Conclusion � Inequality Maps � EC Cartoons � Postscript:Voting Power � References � Acknowledgements � Action Center � Get Involved � E-mail White House � E-mail Congress � E-mail Newspapers � E-mail Political Parties � E-mail Networks � E-mail Media � Calling Cards � Teaching Notes |
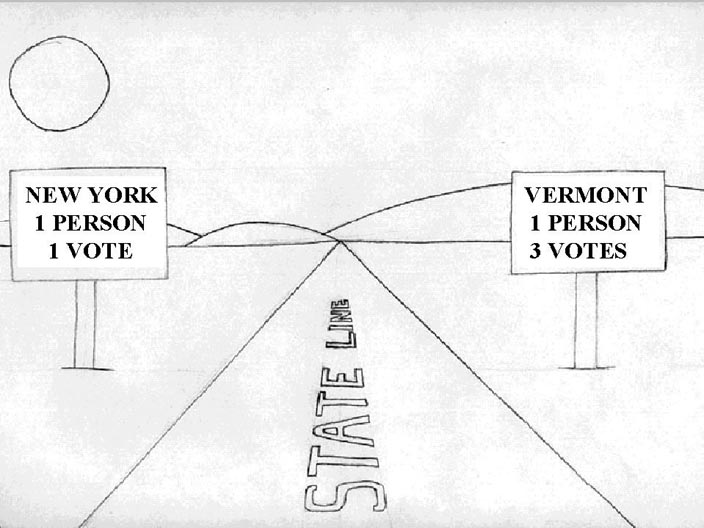
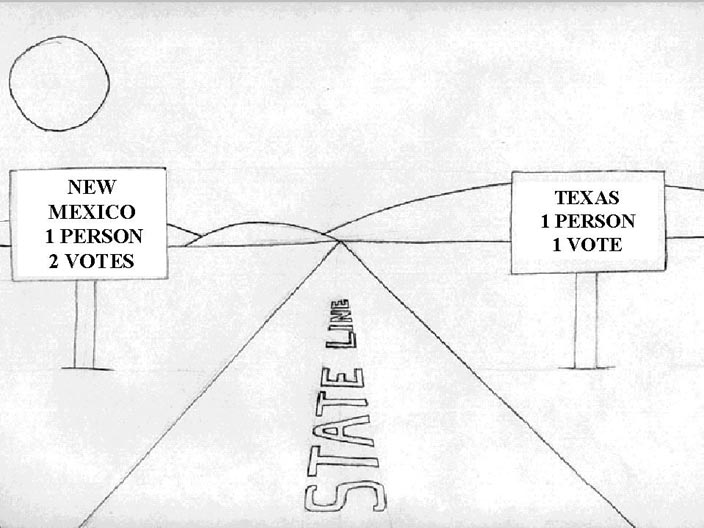
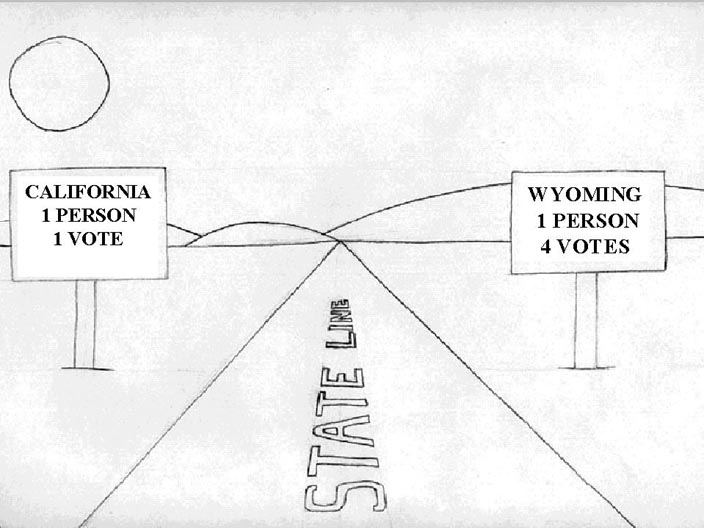
Take a look at the numbers below. One man, one vote should mean that Florida's vote in the Electoral College should be about 32 times that of Wyoming. However, under the Electoral College rules, the Florida vote is only eight times that of Wyoming. Another way of stating it is that the Electoral
College rules understate a Florida vote's influence on the election outcome under the one-man, one-vote principle by a factor of about four. The influence of a Texan's vote is also understated by a factor of about four-i.e., by 390 percent. Don't take my word for it. You can check out these facts yourself. All it takes is an almanac to see how many representatives each state has, and the population figures for each state. The math is quite simple. All the data and math to verify these examples are provided in the previous blue links. These differences in the relative influence of a person's vote in different states are dramatized in the political cartoons below, and throughout this web site. For example see what it means to your vote when you move from state to state in the following cartoons depicting a family registering to vote in the District of Columbia, and in Florida. The next time you drive across a state line think about the differences in the value of a person's vote, as depicted in these cartoons about New York and Vermont, Texas and New Mexico or California and Wyoming.Another way to see how the inequalities caused by these differences in the value of a vote are distributed geographically, is to look at the "Inequality Maps" provided below. These differences are not small. The value of a person's vote varies by as much as four-to-one depending on the state in which you live. If you live in Wyoming, your vote is worth four times as much as a voter in Florida.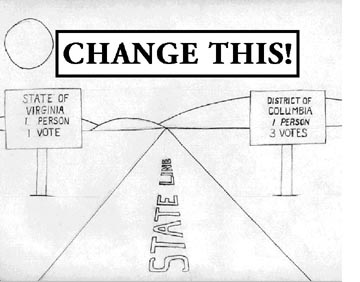
|
PREVIOUS|
HOME |
NEXT
| |